Hi!
I'm Dom,
Data Scientist
About me
Highly motivated, self-driven data scientist with over six years of post-doctoral, quantitative research experience in neuroscience. My general curiosity, analytical mind, and love of learning have propelled me through my scientific career and fostered a passion for programming and data science. This passion drives me to continuously expand and sharpen my data science toolkit and seek out opportunities to leverage my quantitative research skills to extract knowledge and insights from challenging new sources of noisy, structured and unstructured data.

My skills
I have over 12 years of successful quantitative research experience, requiring quick, independent acquisition of domain-specific knowledge and technical skills and implementation of programming-based data acquisition, processing, analysis, and visualization solutions. Notably, I have developed data handling pipelines to manage deep, broad, and complex datasets and generate reproducible results — which are critical for efficient collaboration and effective decision making. I have a proven track record of adapting and expanding my data science skillset to complete the requirements of diverse projects, from dimensionality reduction and general linear model-based estimation of significant voxels in fMRI data to the front-end development of this website.
- Machine Learning
- Tensorflow
- Keras
- Scikit-learn
- Data Visualization
- Matplotlib
- Seaborn
- Powerpoint
- GraphPad
- Data Handling
- Pandas
- NumPy
- PostgreSQL
- SQLAlchemy
- MATLAB
- VBA
- Statistical Analysis
- SciPy
- Statistica
- SAS
- SPSS

My projects
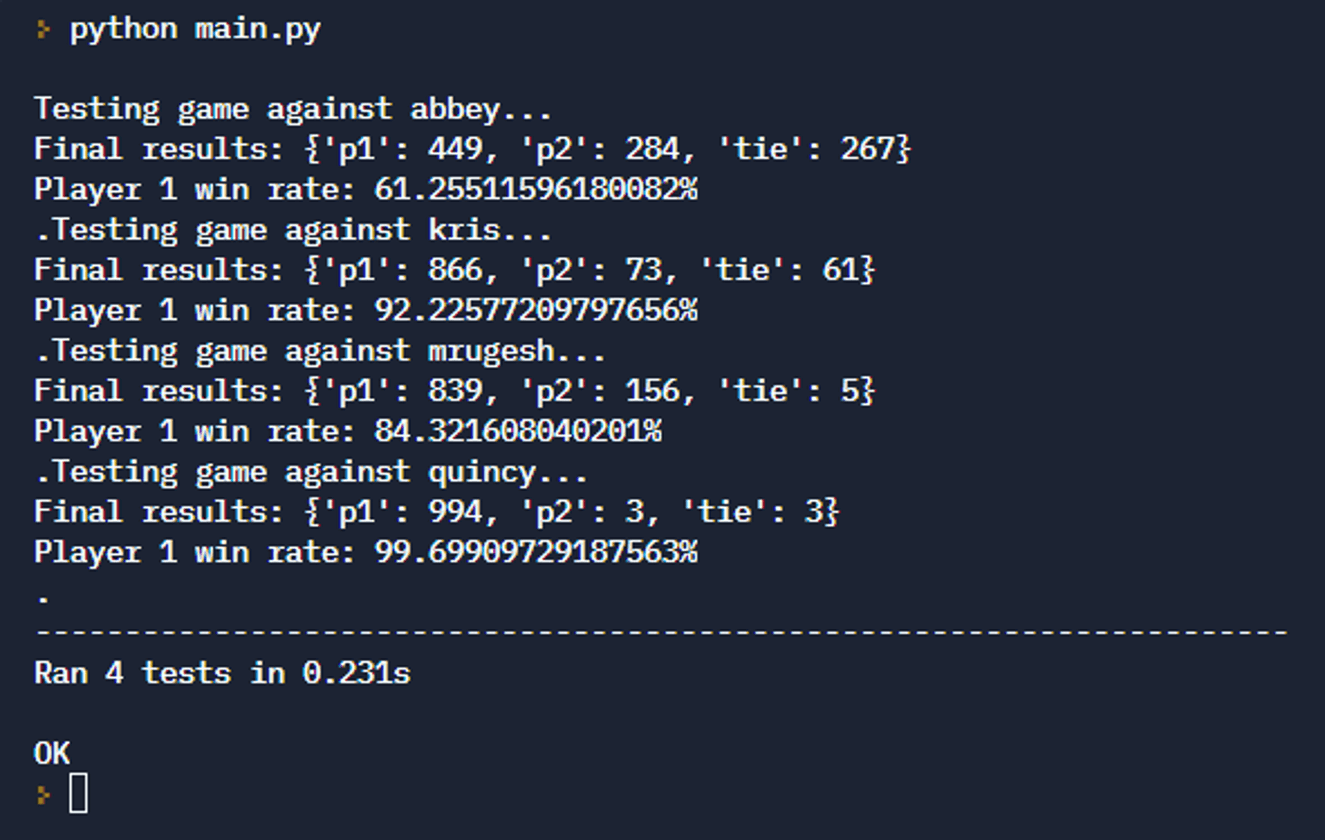
Markov Chain Rock Paper Scissors
The project goal was to create a program with > 60% win-rate in Rock, Paper, Scissors against opponent programs with varied strategies. My tunable solution uses an nth-order Markov chain to "learn" opponent strategies, with optional decay and counter parameters to account for evolving and match-history-based opponent strategies, respectively. For added challenge, I restricted my solution to a single nested function using only native Python packages.
Try on Replit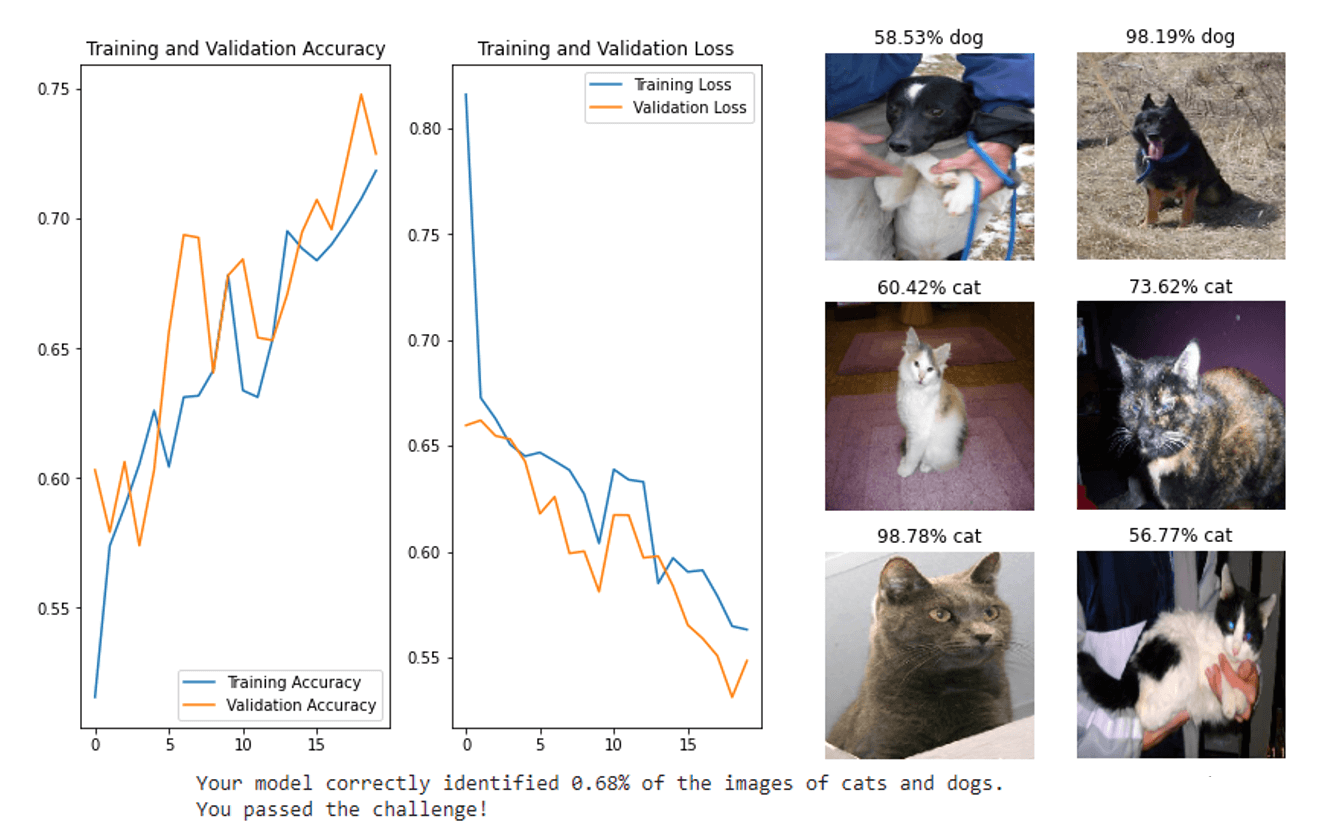
CNN Cat vs Dog Image Classifier
This project was to correctly classify dog and cat images with >= 63% accuracy from a training/validation set of 3000 images within a simple predefined workflow. My solution uses a convolutional neural network with two convolutional layers and straightforward data augmentation, built in Keras and Tensorflow 2.0, to achieve 68% test accuracy. While not within the limited criteria for this project, higher accuracy can be achieved with similar "compute" by using transfer learning with pre-trained models like MobileNet v2 or automated architecture and hyper-parameter tuning.
Try on Colab
KNN Book Recommendation Engine
The goal of this project was to generate book recommendations from a dataset of 1.1 million ratings for 270,000 books from 90,000 users. To this end, I used the K-Nearest Neighbors algorithm from Scikit-learn to measure the cosine distance between books and return the five closest matches to a given book argument. I provide an initial solution designed to produce a predetermined test outcome, then improve upon it with more appropriate handling of missing data, data filtering, and recommendation ordering.
Try on Colab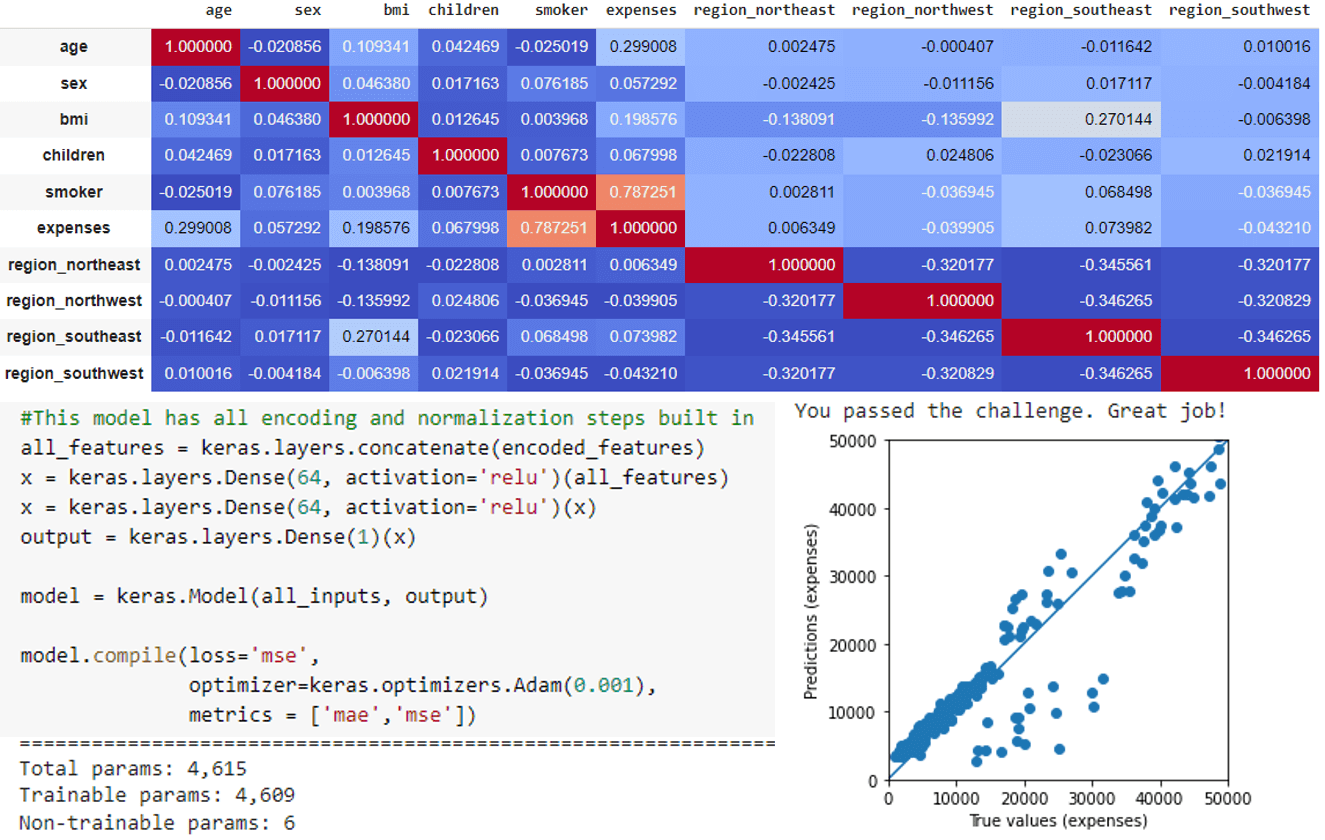
DNN Regression Health Cost Calculator
For this project, I was tasked to predict health care expenses within $3500 using demographic data from 1070 patients. I was able to predict expenses from a test sample within $2723 using a deep neural network model with two dense layers designed in Keras and Tensorflow 2.0. To improve predictions, I selected only the features correlated with expenses. To make the model end-to-end, accepting raw data as input, I included all normalization and encoding steps as preprocessing layers.
Try on Colab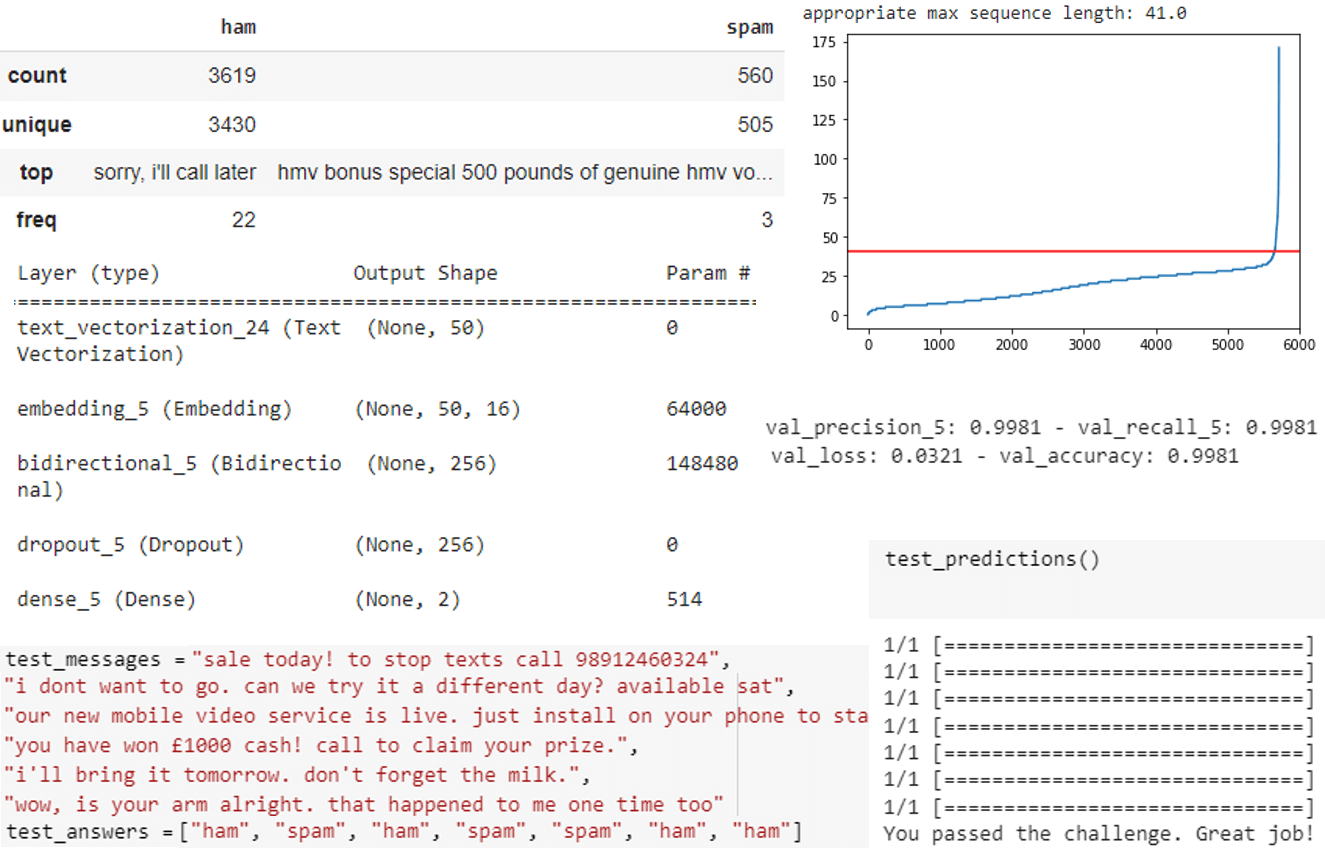
RNN SMS Text Classifier
The challenge for this project was to classify SMS messages as either "ham", normal messages from friends, or "spam", advertisements from companies, etcetera. My model, with one bidirectional, long short-term memory, recurrent neural network layer and baked-in data cleaning/standardization, text vectorization, and word embedding layers achieved a validation accuracy, precision, and recall of > 99.8% and accurately classified predetermined test cases. Notably, the training data was imbalanced with 3619 ham and 560 spam messages, so I oversampled the minority class to reduce majority bias.
Try on Colab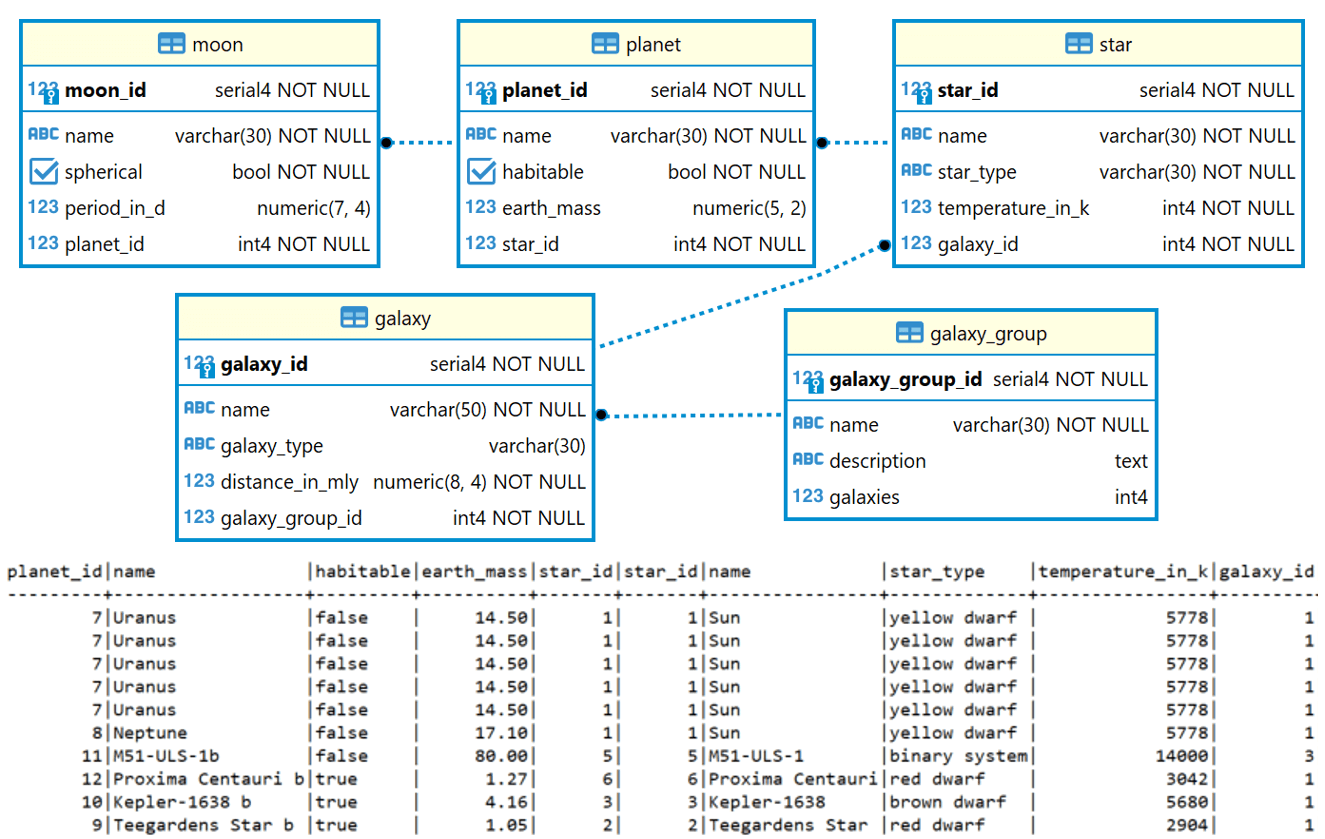
Celestial Bodies Database
In this simple project I constructed and populated a relational database of celestial bodies from scratch using PostgreSQL command-line statements.
GitHub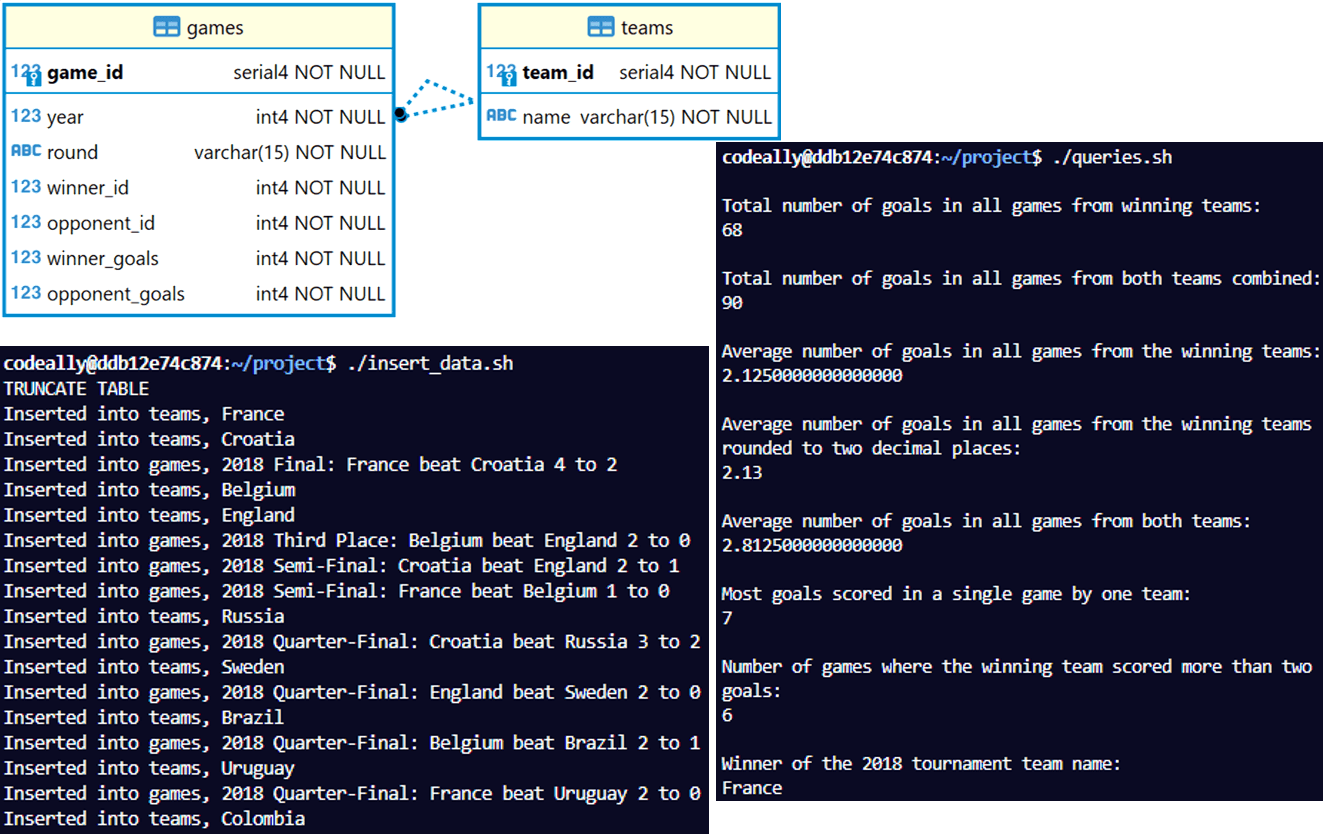
World Cup Database SQL Scripts
For this project, I constructed a relational database for data from the final three rounds of the World Cup tournament since 2014, wrote a Bash script to populate the database from a tabular data file, and finally wrote a Bash script to execute several queries for different user stories and output the results.
GitHub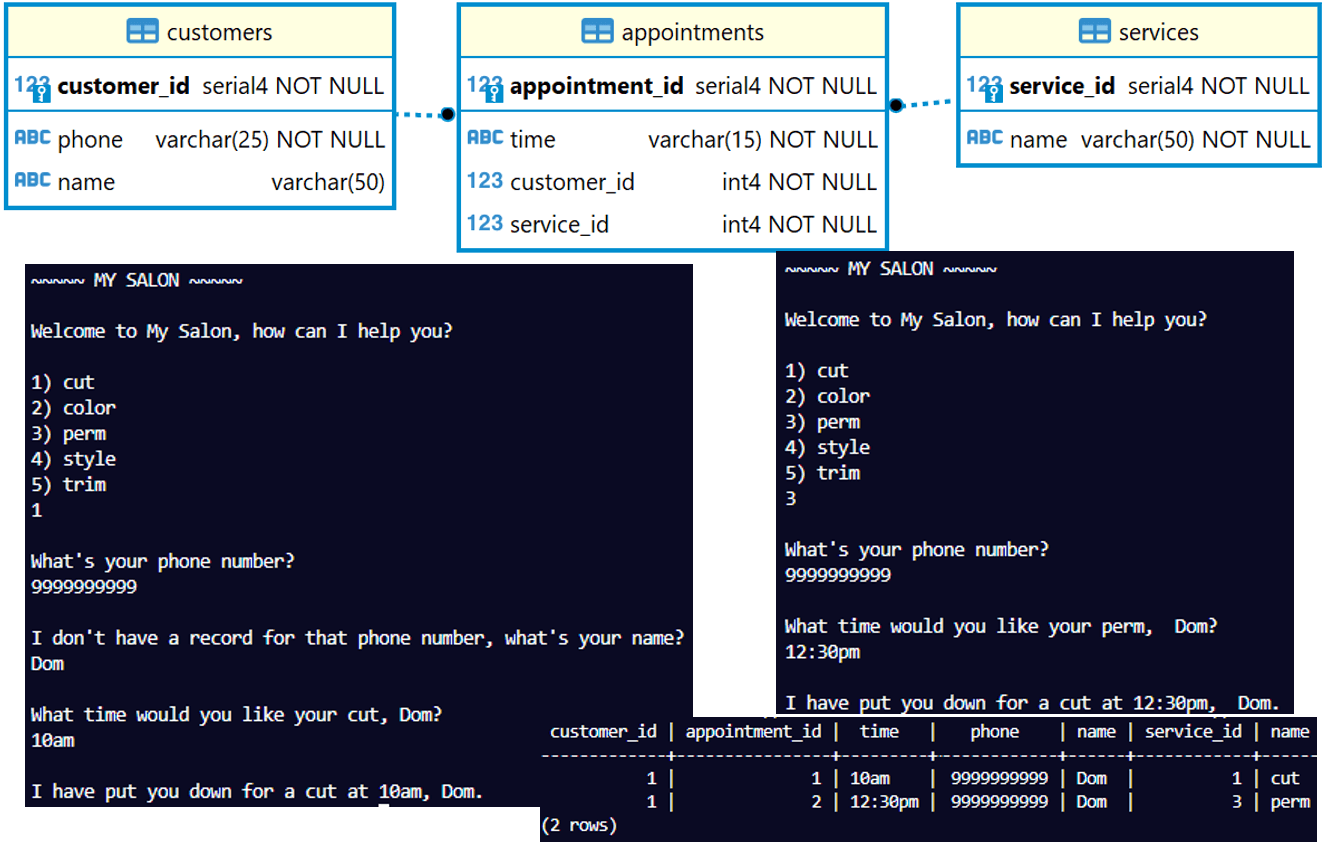
Salon Appointment Scheduler
The goal of this project was to create a user interface to keep track of salon customers and their appointments. I created a relational database with PostgreSQL to track customers, salon services, and appointments, and wrote an interface in Bash to query and insert information related to dynamically generated user prompts.
GitHub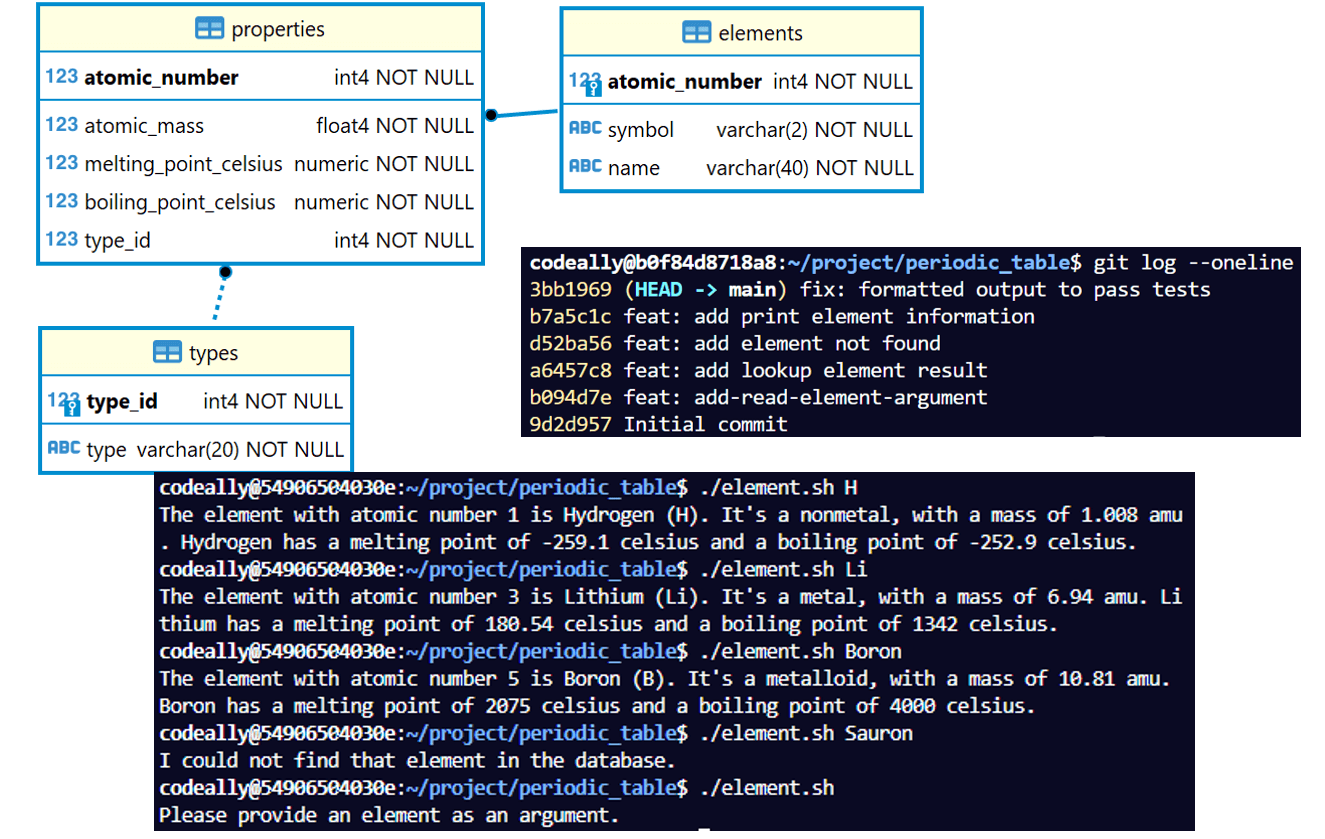
Periodic Table Lookup Script
For this project I used PostgreSQL to fix and update an existing database containing periodic table elements and their properties and created a small Bash program to output information about an element given a valid atomic number, symbol, or name. Notably, development of this code was version controlled in a Git repository using best practices.
GitHub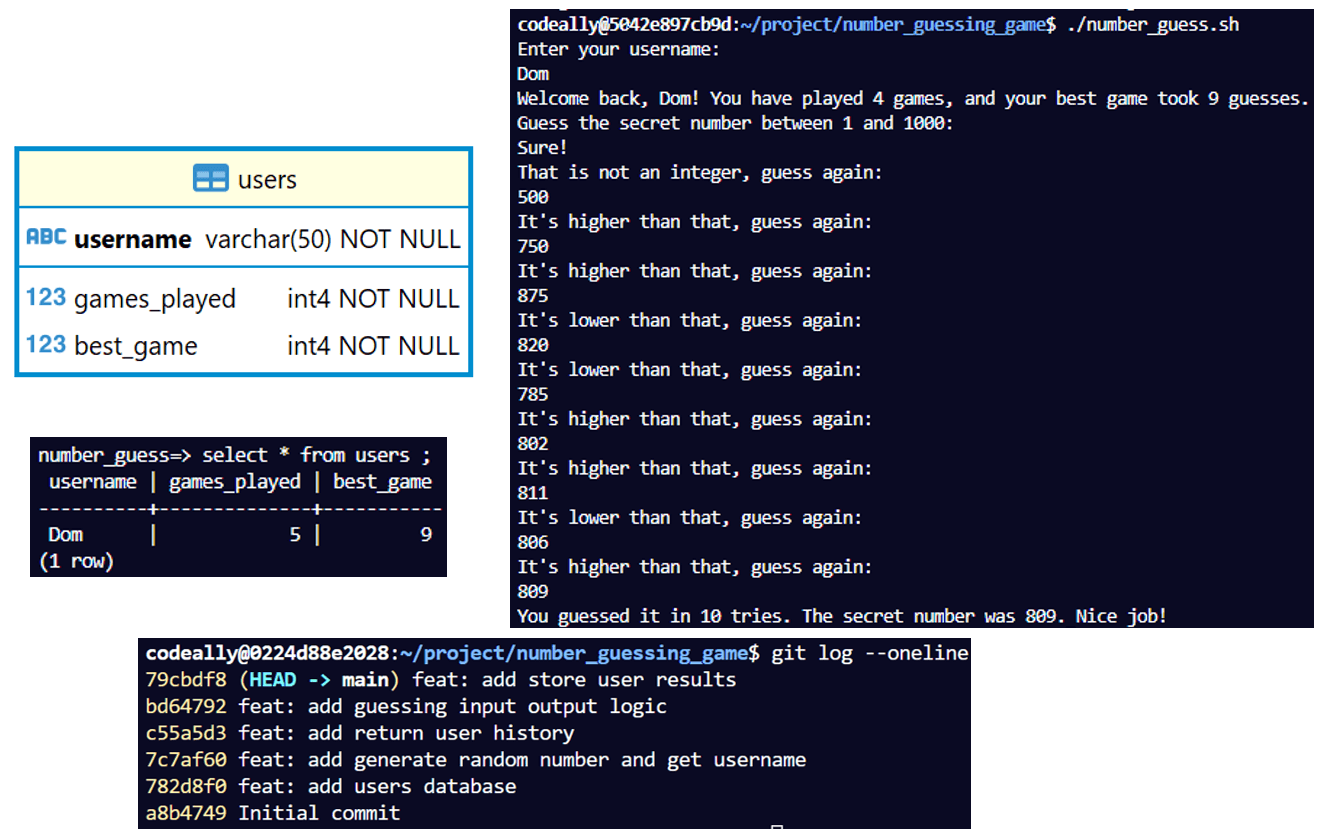
Number Guessing Game
The goal of this project was to create game where users guess a hidden random number between 1 and 1000 and track users' game history. Using Git best practices for version control during development, I created a small relational database with PostgreSQL to store usernames, high scores, and games played, then wrote a Bash user interface to control the game logic, display dynamic user prompts, and automatically query, update, and insert information into the game history database based on user input.
GitHub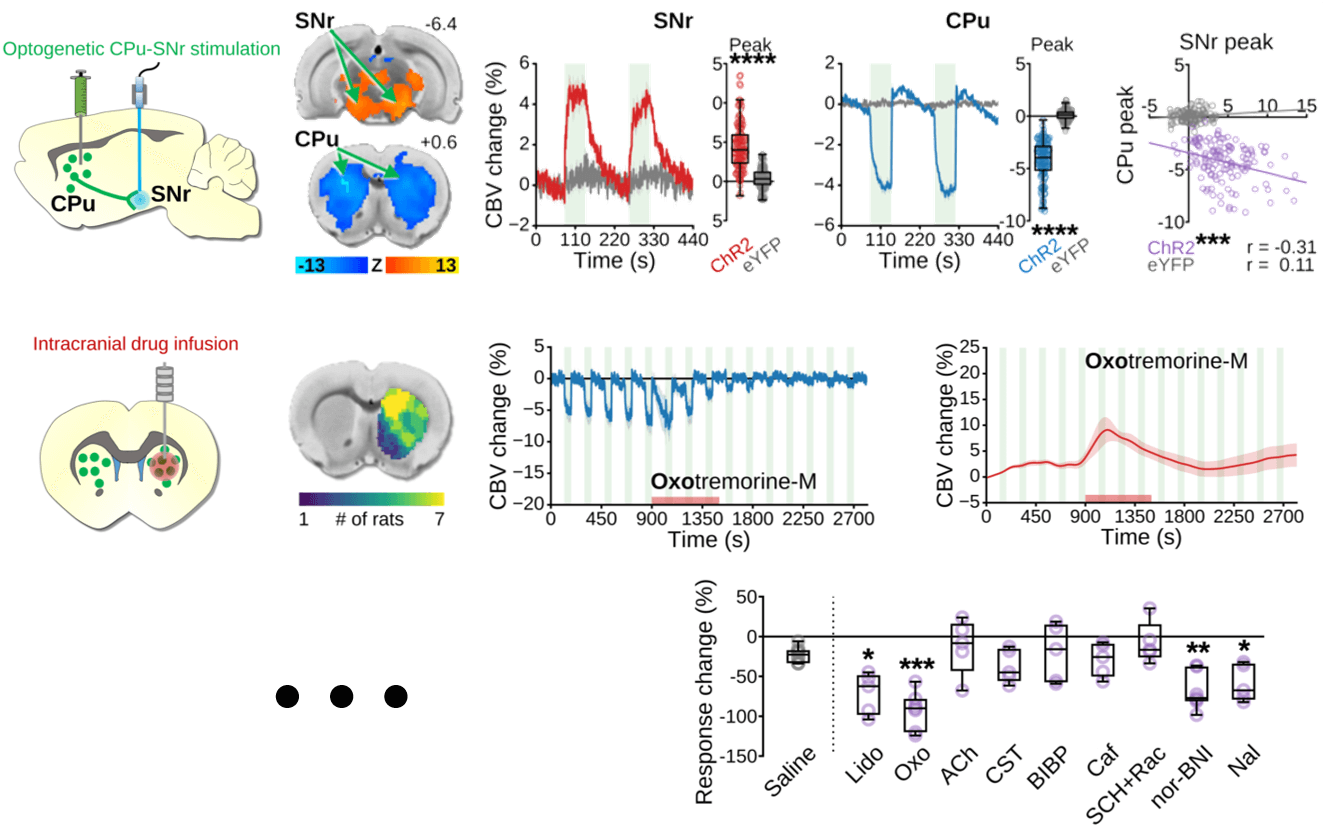
fMRI Data Handling and Analysis
To handle and analyze large 4D fMRI datasets efficiently and reproducibly, I made a Python wrapper to pass fMRI data through a pipeline package, developed by a colleague, that executes standard preprocessing and subject-level general linear model analyses of event-related fMRI data. For subsequent group-level analyses, pipeline results are passed via shell scripts within my wrapper to open-source fMRI analysis software for significance testing of 3D voxels and clusters. For further analyses of fMRI signal changes extracted from brain regions of interest, I created sequential functions to detrend, wrangle, find peaks in, and visualize peri-event time-series data using several Python libraries including: Pandas, NumPy, Matplotlib, Seaborn, and Scikit-learn.
GitHub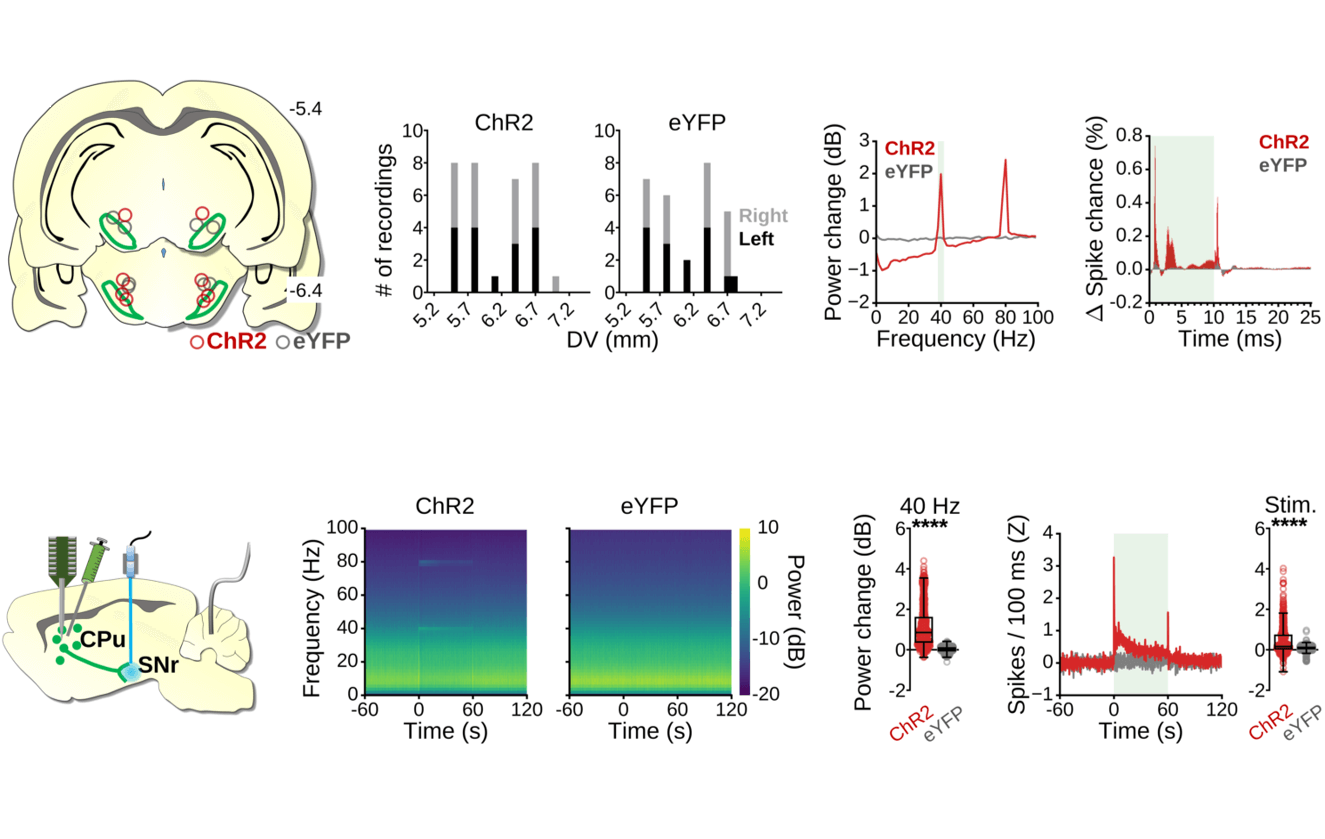
Electrophysiology Data Handling and Analysis
To handle and analyze large, high-frequency, multi-channel, event-related electrophysiology data, I created Python batch preprocessing scripts to export proprietary format multi-unit, local field potential, and single-event-resolution data to accessible tabular data formats. For group-level analyses of the preprocessed data, I created sequential functions to detrend, normalize, wrangle, find peaks in, and visualize the peri-event time-series and/or spectral power information in these datasets with several Python libraries including: Pandas, NumPy, Matplotlib, Seaborn, and Scikit-learn.
GitHub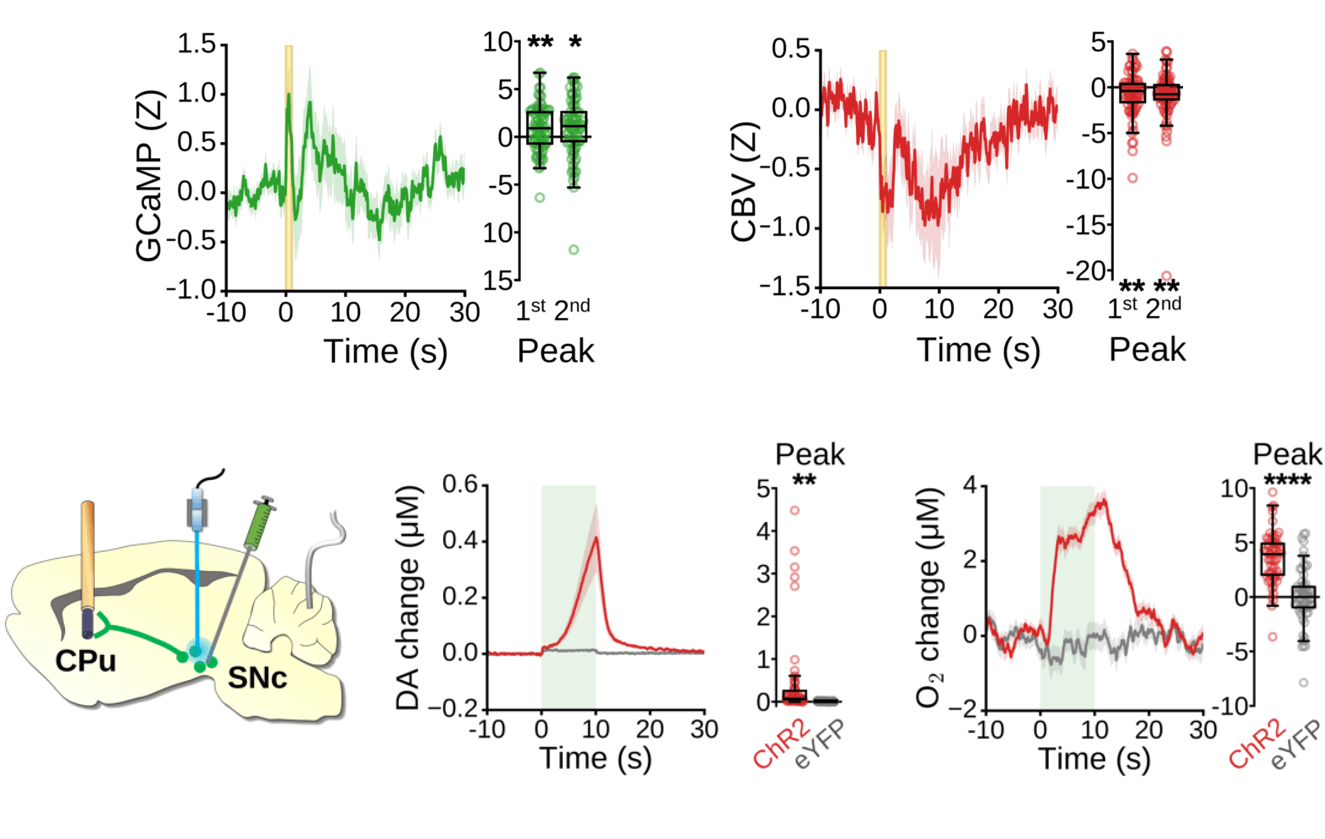
Photometry and Voltammetry Data Handling and Analysis
To preprocess, detrend, normalize, wrangle, detect peaks in, and visualize high-frequency, peri-event, time-series data from multi-spectral photometry and fast-scan cyclic voltammetry recordings, I created sequential Python functions using several libraries including: Pandas, NumPy, Matplotlib, Seaborn, and Scikit-learn. In addition, for the detection of spontaneous activity in photometry data without discrete experimental events, I added additional functions using the SciPy library to high-pass filter raw time-series data and apply threshold, width, and timing constraints to peak detection.
GitHub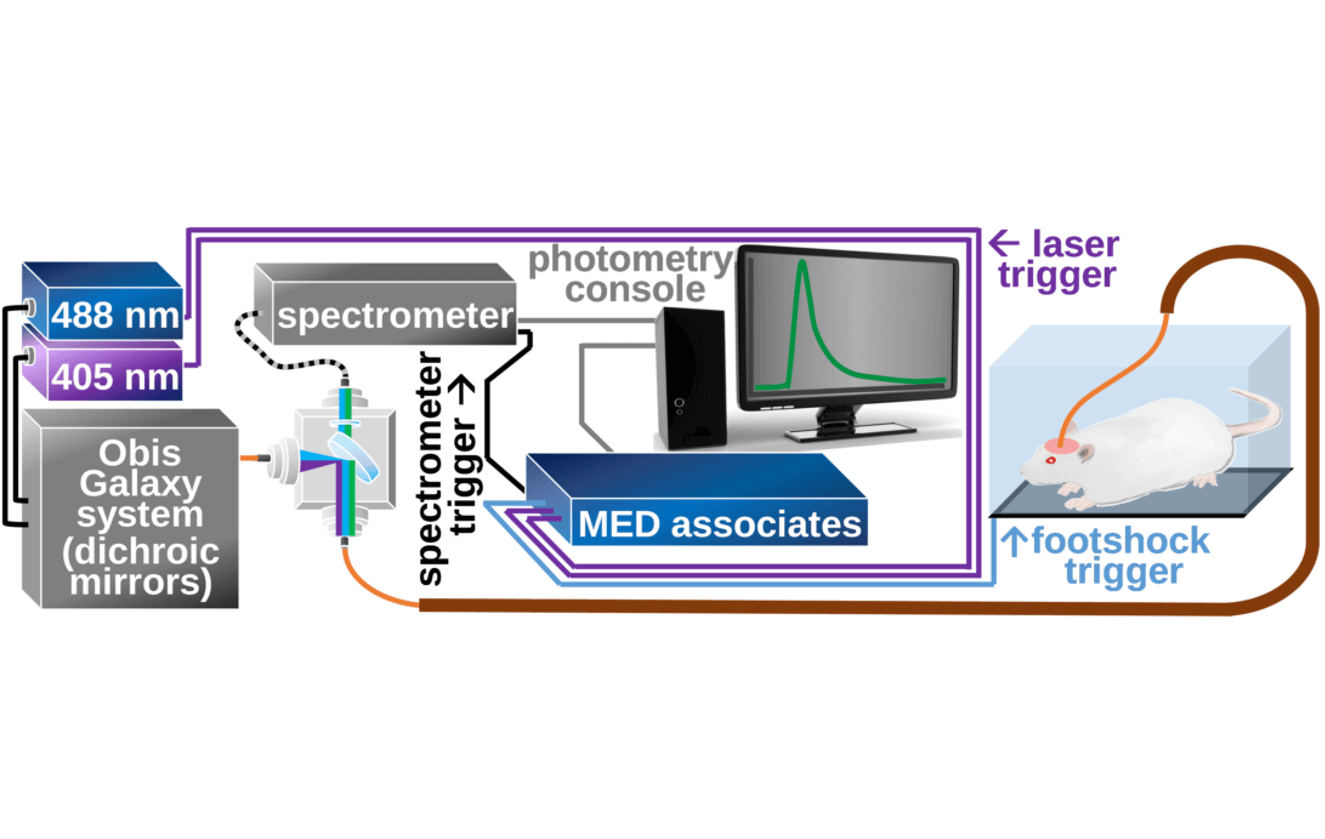
Animal Behavior and Hardware Synchronization
Behavioral and/or multimodal neuroscience experiments often require precise, automatic, timing and synchronization of manipulations and measurements — operating under a conditional logic framework. For this purpose, I have written several scripts in the proprietary state-notation language, MedState, designed for specific or modular experimental paradigms, behavioral tasks, and/or hardware configurations.
GitHub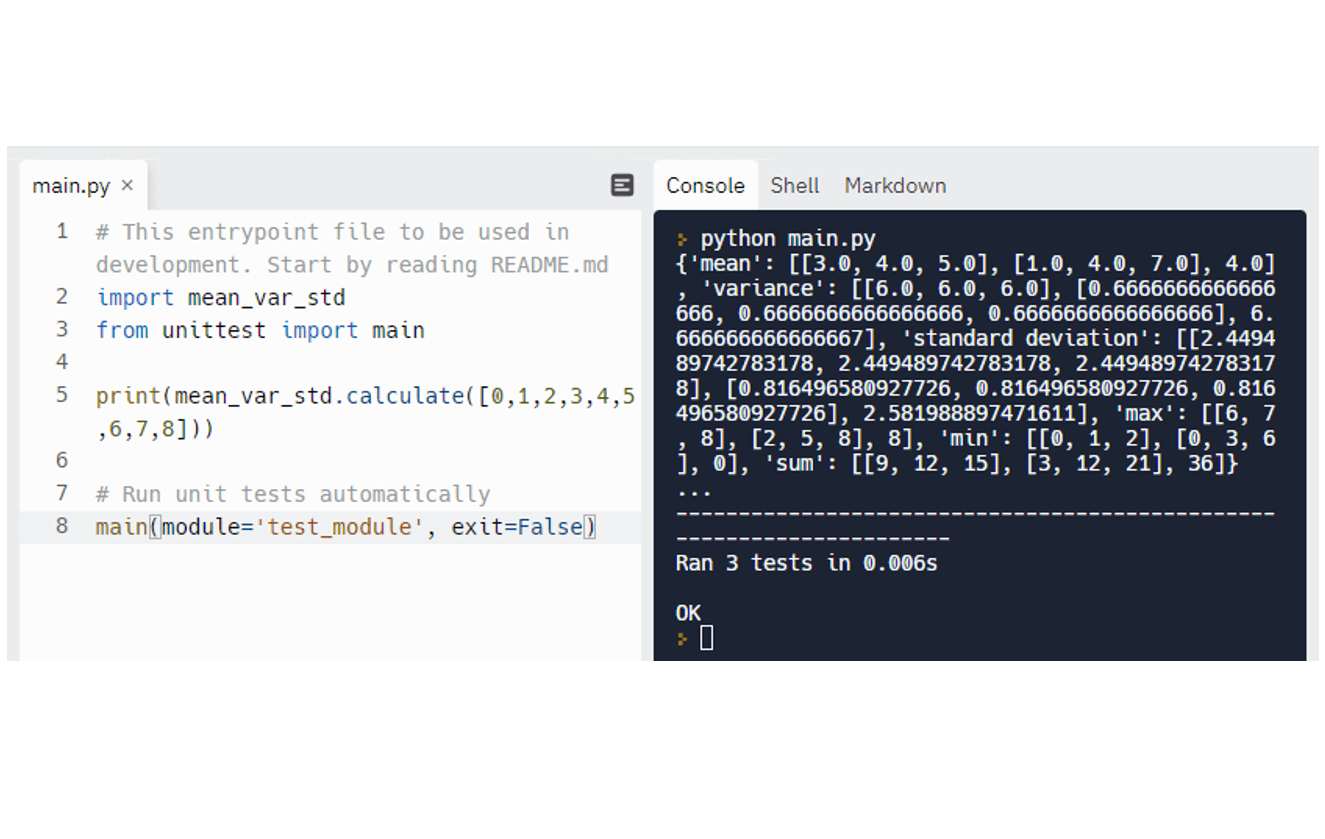
Mean Variance Standard Deviation Calculator
For this project, I wrote a simple Python function that accepts a list of nine digits (otherwise raising a ValueError), converts them into a 3x3 NumPy array, then returns a dictionary containing the mean, variance, standard deviation, maximum, minimum, and sum along both axes and for the flattened matrix.
Try on Replit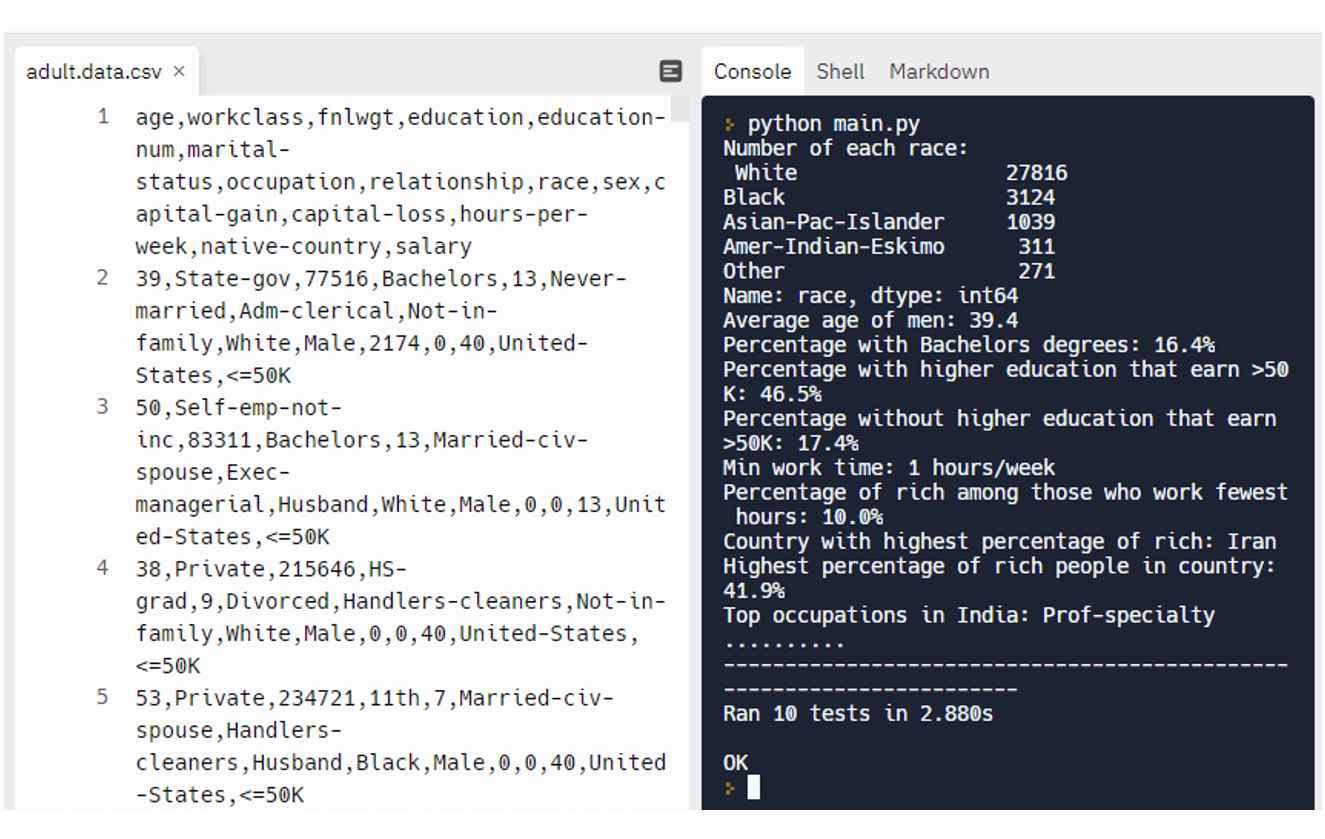
Demographic Data Analyzer
In this project I created a Python function to calculate and optionally print demographic data from the 1994 Census database. The raw tabular data was read into a Pandas DataFrame and a variety of functions were used to index, filter, and transform the data to answer a series of specific questions.
Try on Replit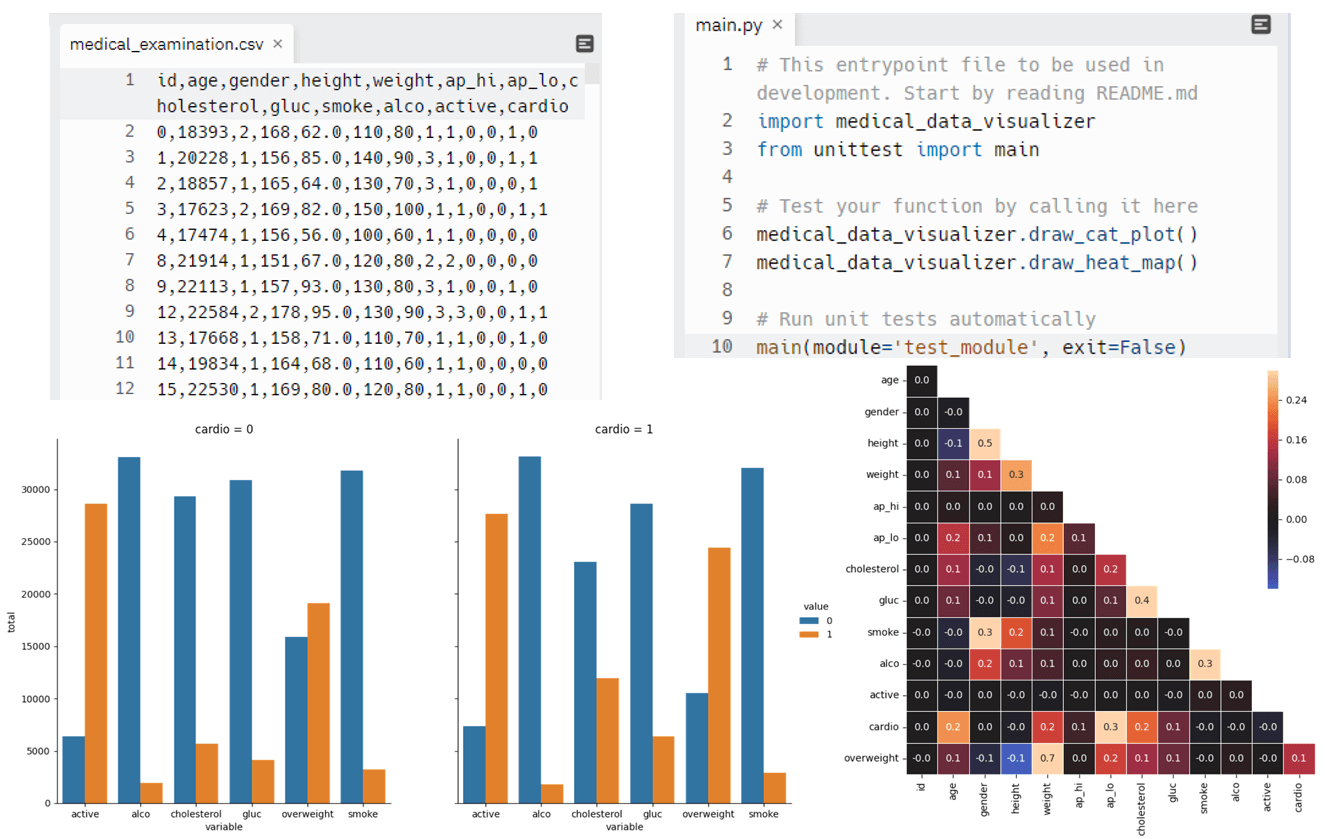
Medical Data Visualizer
The goal of this project was to visualize and make calculations from tabular medical examination data. In Python, I used Pandas DataFrame functions for feature engineering, normalization, data cleaning, and data wrangling, and created functions to generate categorical plots and heatmaps of the processed data with Matplotlib and Seaborn.
Try on Replit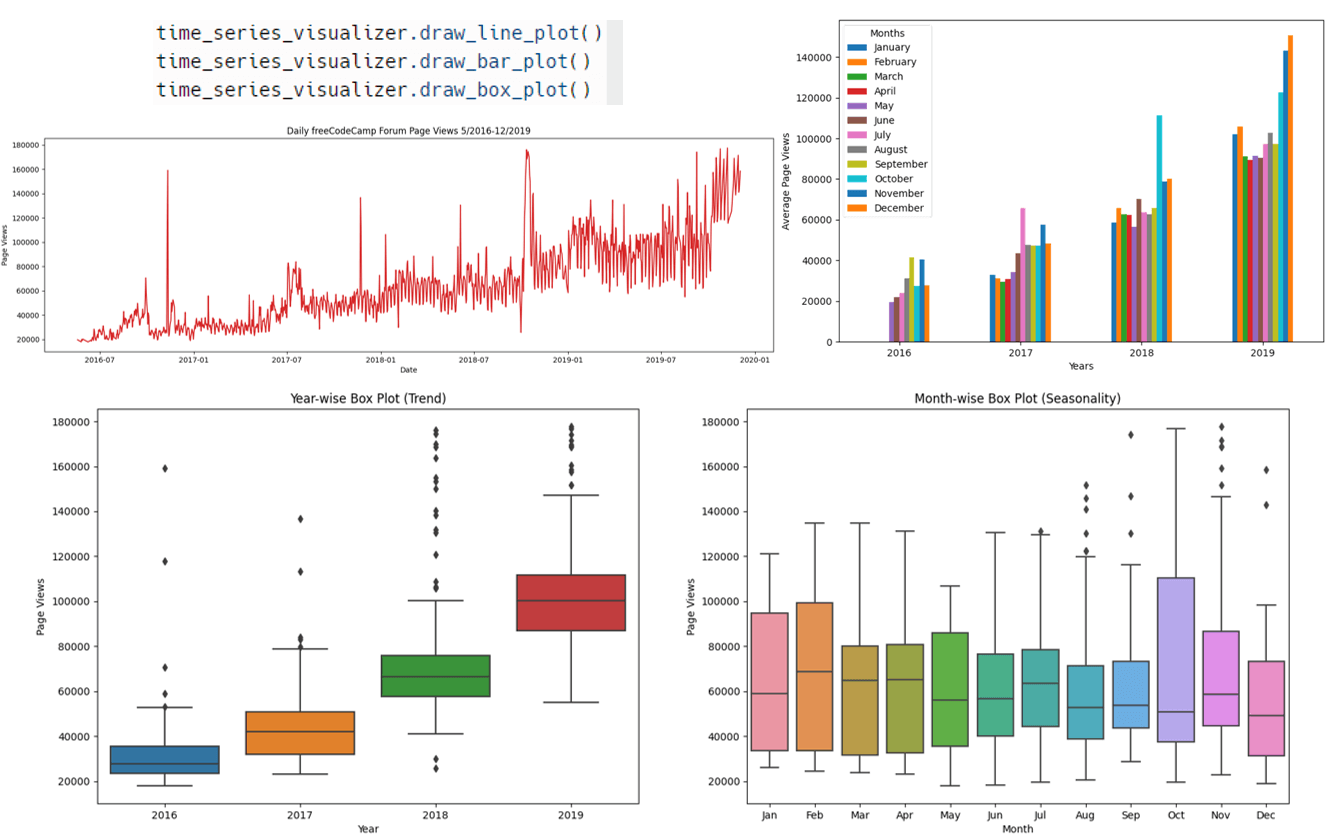
Page View Timeseries Visualizer
For this project I created visualizations with Python for a tabular dataset containing the number of daily page views on the freeCodeCamp.org forum from 2016-05-09 to 2019-12-03 in order to help understand the patterns in visits and identify yearly and monthly growth. To this end, I cleaned and wrangled the data in Pandas and created plotting functions with Seaborn and Matplotlib for an exploratory line plot, a bar plot categorized by month and year, and box plots categorized by either month or year.
Try on Replit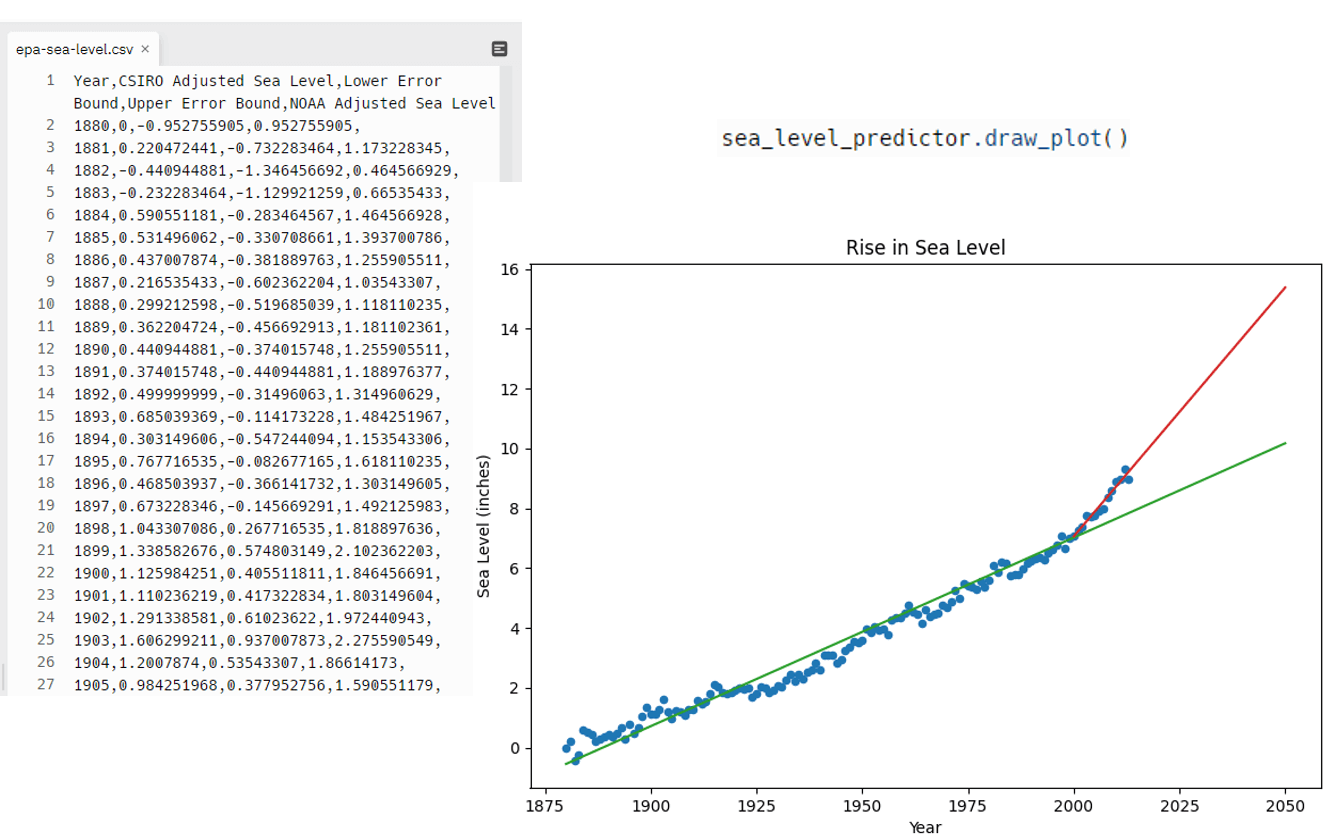
Sea Level Predictor
This project's challenge was to predict sea level change through the year 2050 from global average sea level changes reported by the EPA since 1880. My solution is a Python function which creates a scatterplot of the original data with Matplotlib and overlays a line of best fit calculated by the SciPy linregress function for the total dataset and for only years after 2000. As an extra challenge, I extended the x-axis date range with Pandas date-time functions instead of simply creating NumPy integer vectors.
Try on Replit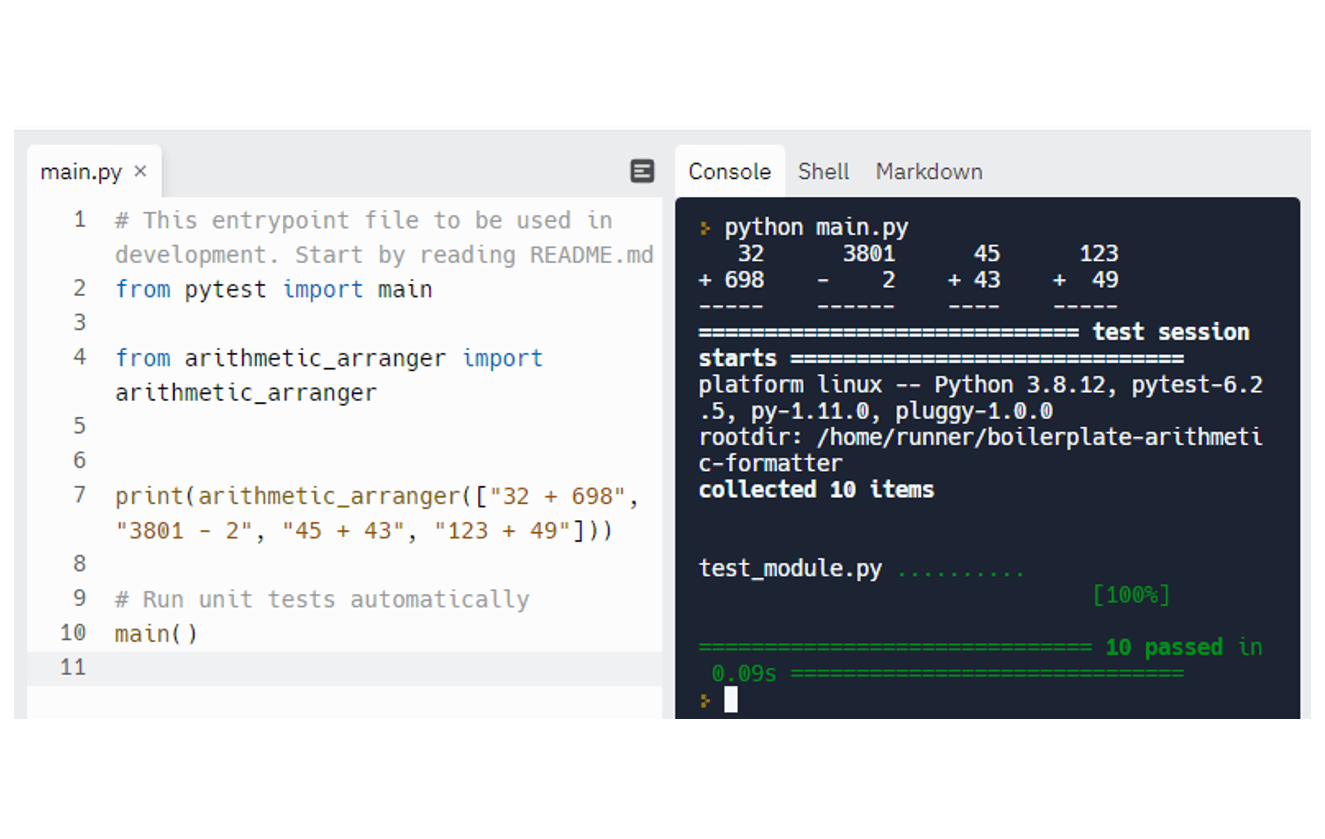
Arithmetic Formatter
I wrote a Python function that takes a list of arithmetic problems and arranges them vertically and side-by-side cleanly and consistently — similar to grade school math worksheets. In addition, this function returns meaningful error prompts for different types of invalid input, and accepts an optional argument to print the results.
Try on Replit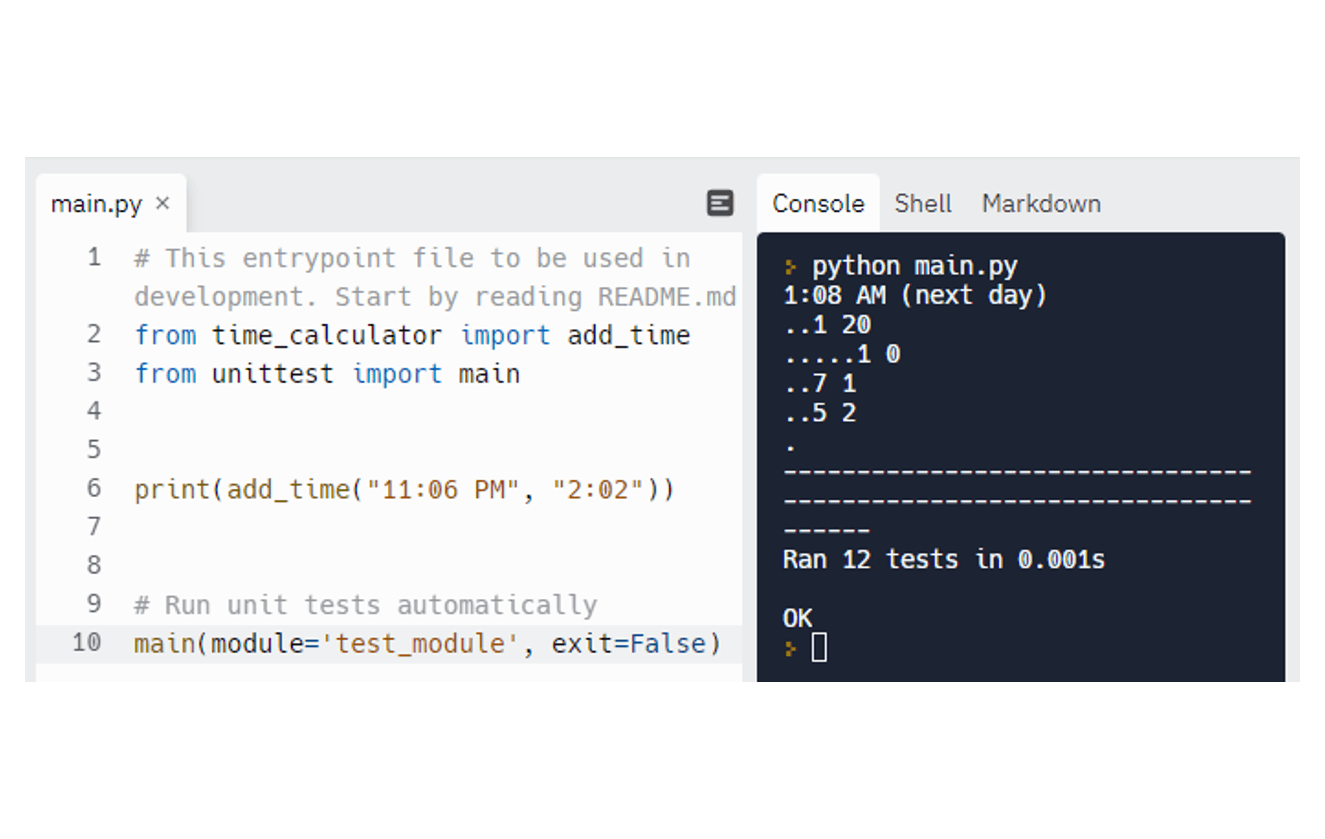
Time Calculator
This is a Python function I created that takes a start time and duration and returns a cleanly-formatted string with the end time, including the number of days later if applicable, and the day of the week if a starting day is specified. I included a helper function to convert AM and PM to 24-hour time which reduced the complexity of the time calculation function.
Try on Replit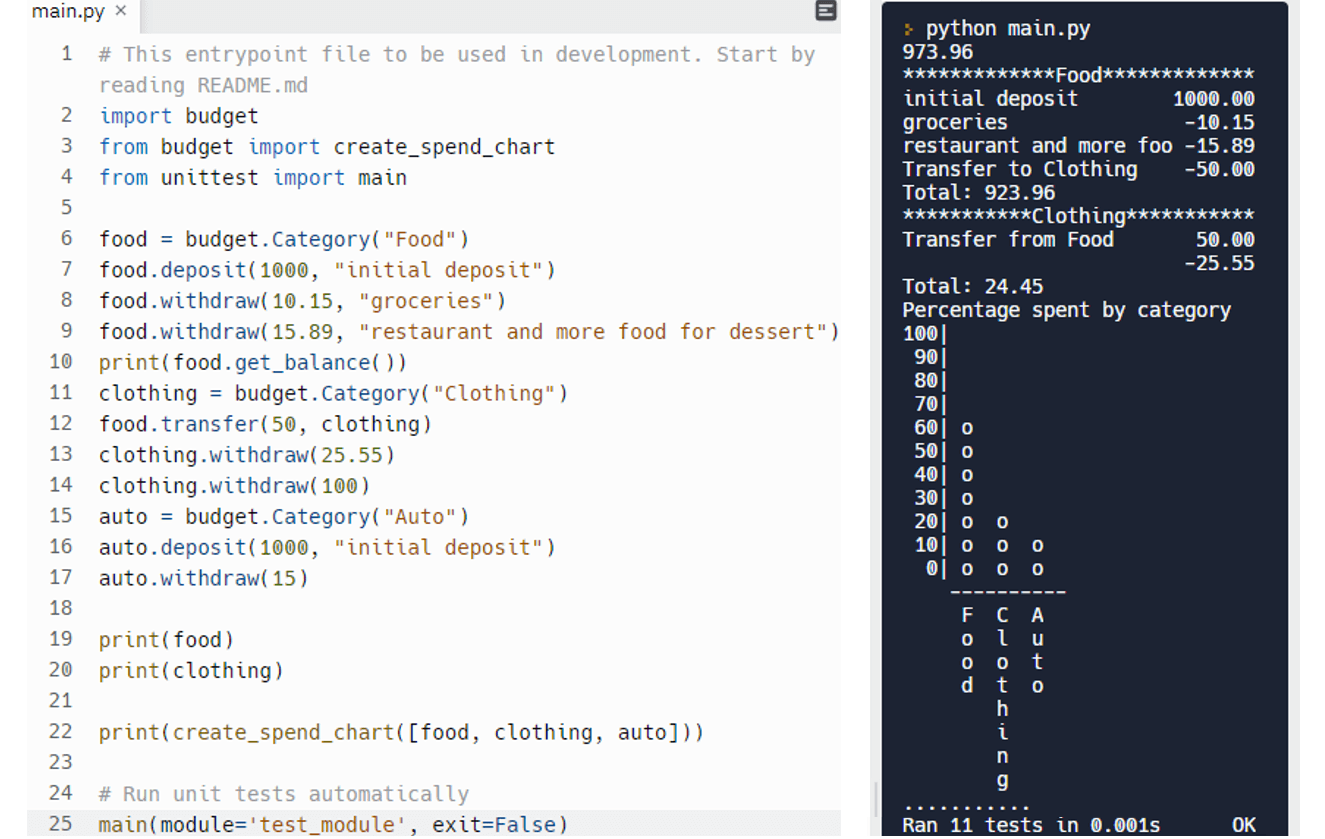
Budget App
To make an open-ended command-line budget app, I used Python object-oriented programming to create a Category class that can instantiate objects based on different budget categories like food, clothing, auto, etc., has methods to deposit, withdraw, get balance of, transfer, or check funds, and keeps a ledger of all transactions. In addition, I included a function to return a spending chart, cleanly and consistently formatted to print in the command line, that displays the percentage of the total budget spent in each category.
Try on Replit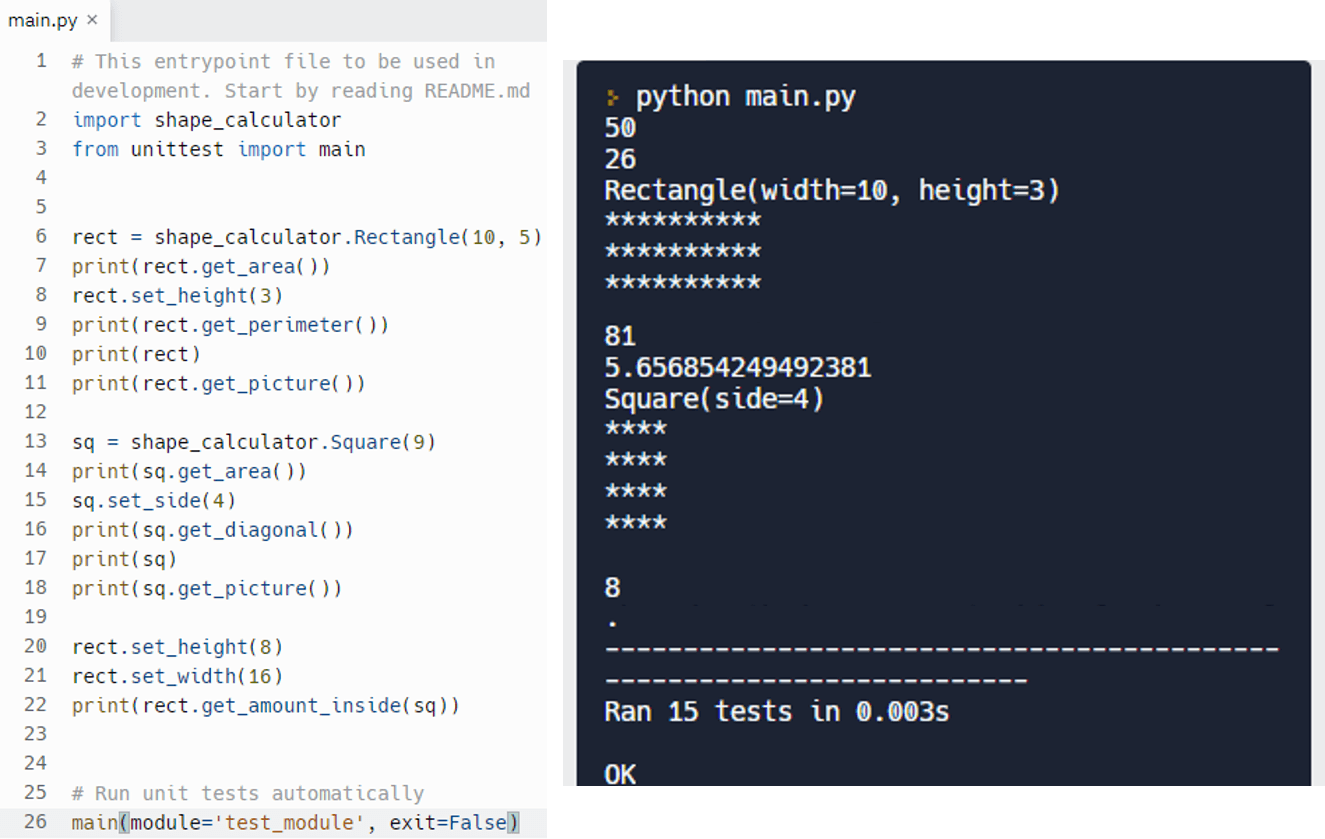
Polygon Area Calculator
For this project I used Python object-oriented programming to create a Rectangle class with a Square subclass inheriting its methods, including: setting height or width, getting the area, perimeter, or diagonal length, returning a cleanly-formatted text picture of the shape for command-line printing, and calculating the number of one shape object that could fit in another. To maintain equal side lengths in the Square class, the set height and set width methods and a new method to set side length are functionally equivalent.
Try on Replit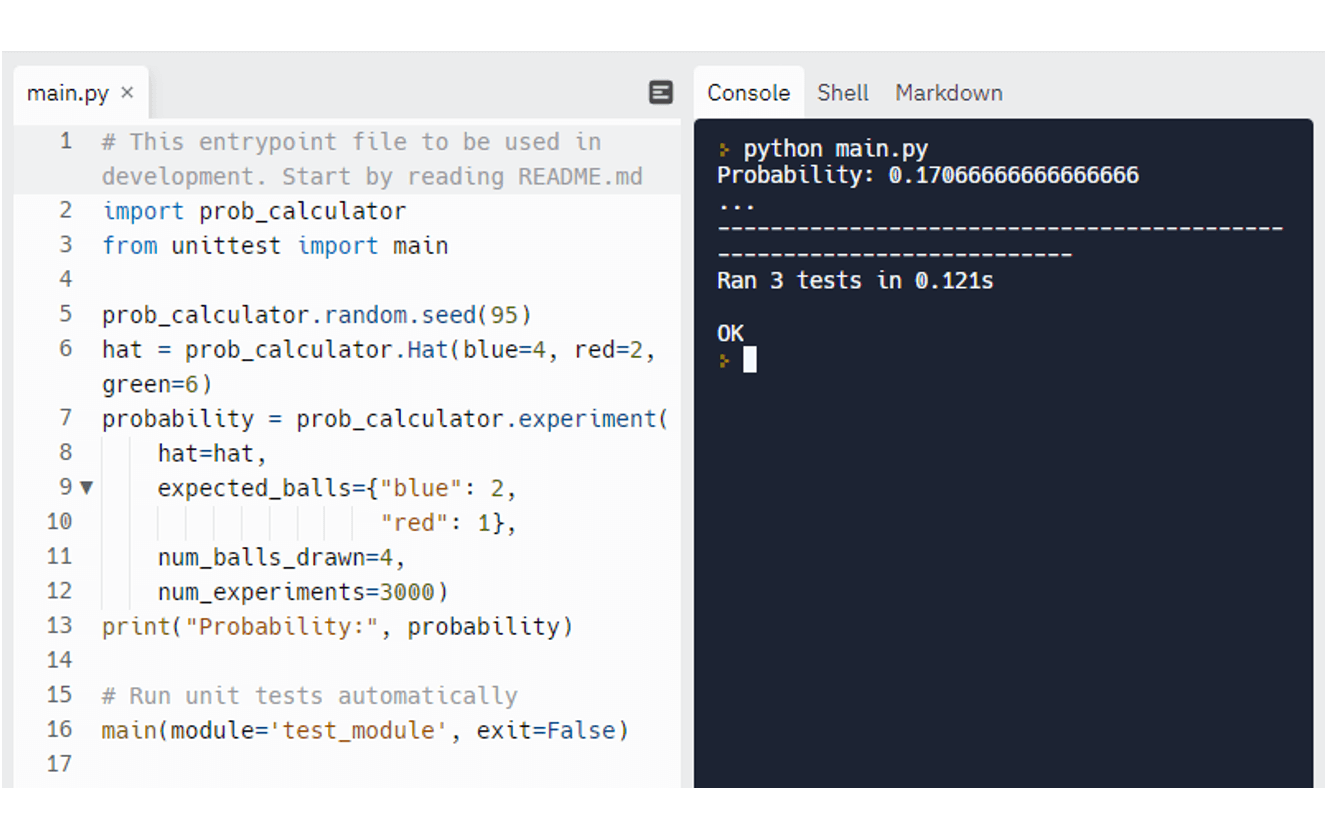
Probability Calculator
This project is a simulation of the classic "urn problem". In this instance, a certain number of balls are drawn without replacement from a hat, then it is determined if an expected combination of balls is in the draw or not. To calculate the experimental probability of getting an expected ball combination in one draw, I used Python object-oriented programming to create a Hat class with a ball drawing method and an Experiment function to copy a hat object, draw balls and check the outcome, then repeat the process a large number of times.
Try on Replit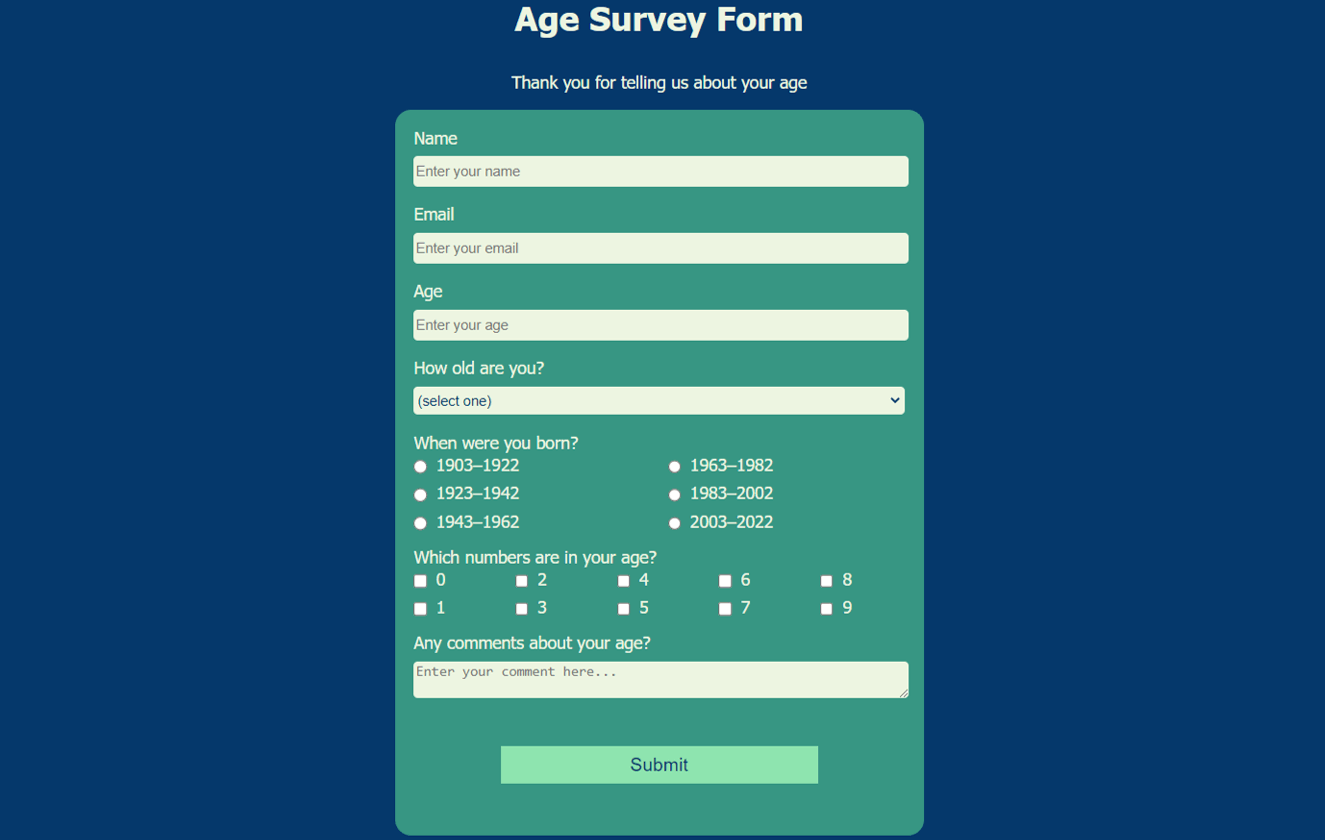
Survey Form
For this simple project, I created a template survey form using HTML5 and CSS3. It includes a form element with a variety of styled input elements including text, drop-down selections, radio buttons, and checkboxes.
Try on CodePen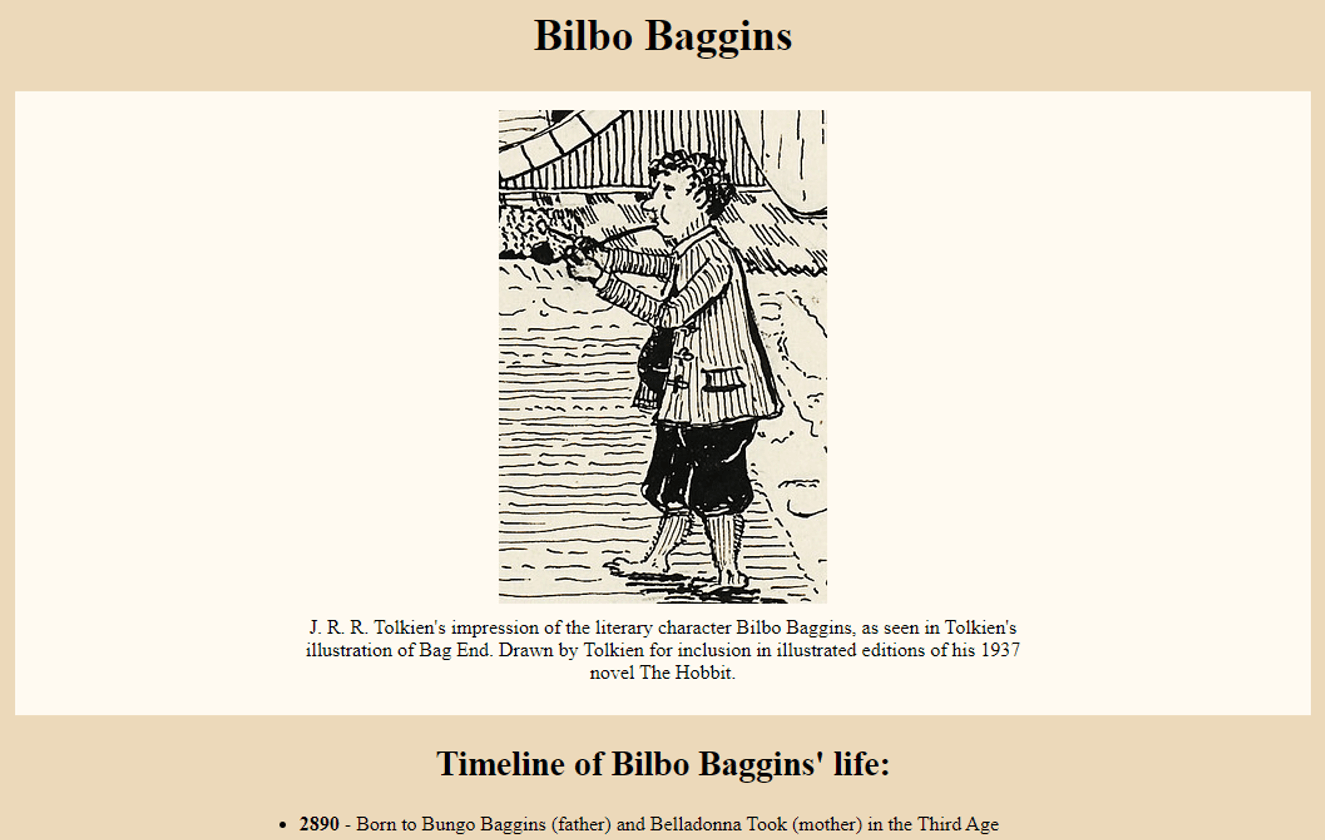
Tribute Page
This is just a simple tribute page for J.R.R. Tolkien’s character, Bilbo Baggins, that I created using HTML5 and CSS3. All content was borrowed from the unofficial J.R.R. Tolkien Wiki.
Try on CodePen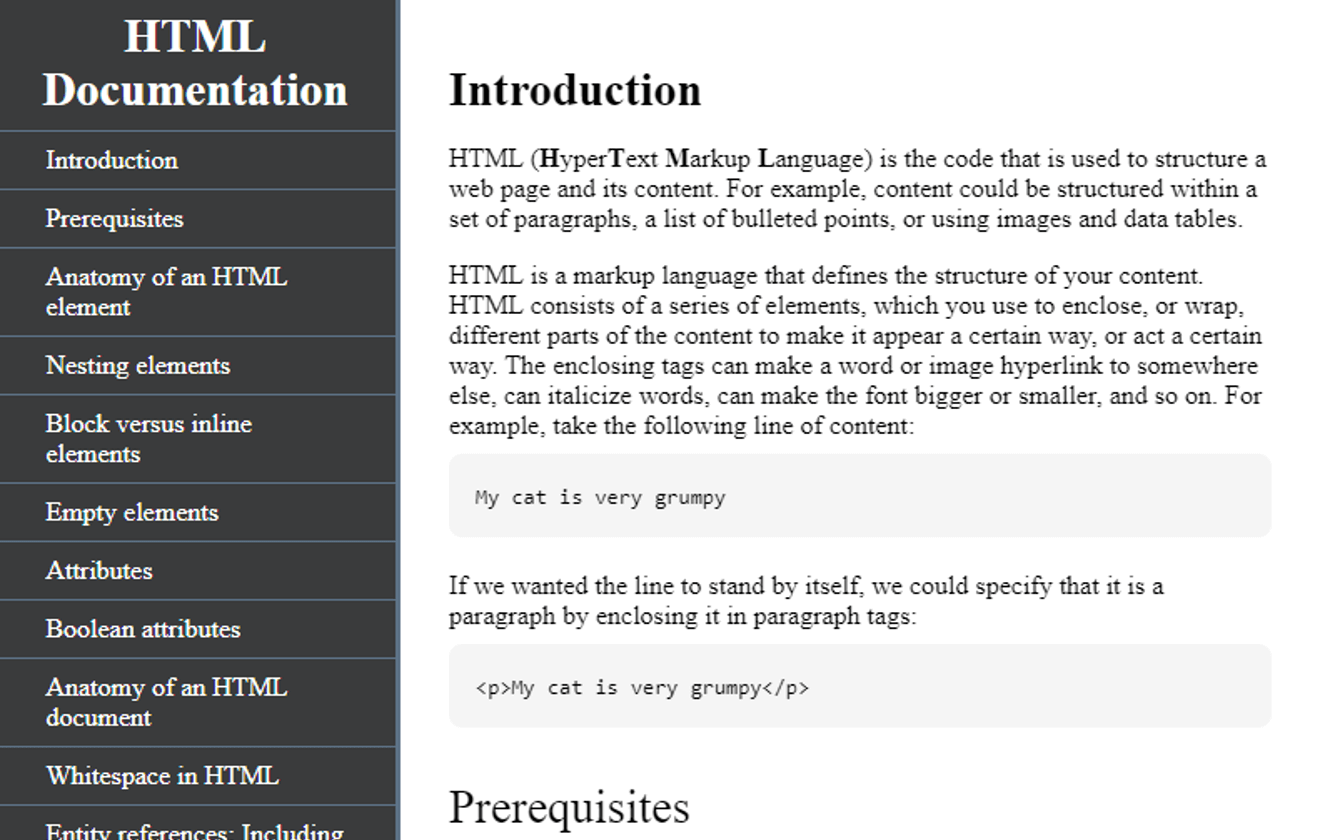
Technical Documentation Page
For this project I built a technical documentation page using HTML5 and CSS3. To organize and navigate this text-heavy page, I divided the content into several section elements, each further divided by a variety of additional elements with associated CSS properties. I also included a navigation bar that shifts position to accommodate smaller screen sizes. The page content, an HTML tutorial, was sourced from MDN Web Docs.
Try on CodePen
Product Landing Page
The goal of this project was to build a product landing page using HTML5, CSS, and responsive web design. I designed a page to sell Dutch Stroopwafels with simple styling to resemble the Netherlands flag. The page content includes a navigation bar and logo, hero with email sign-up form, product description, instructional video, and order form. I used CSS Flexbox layouts and CSS media queries, and relative sizing for the embedded iframe video and container to automatically adjust the page content for improved viewing on different screen types.
Try on CodePen
Personal Portfolio Page
This project is the first version of this website. I built it from the ground up using HTML5 and CSS3, with minimal JavaScript to handle opening and closing the mobile navigation menu and project descriptions, provide unobtrusive feedback for contact form submissions, and automatically update the copyright date. I achieved clean, consistent, styling across all screen types using relative font-size units, CSS Grid and Flexbox layouts, and CSS media queries. Notably, I use an embedded Google Form to handle the direct contacts from this page for free, without limits or requiring a custom backend.
Try on CodePen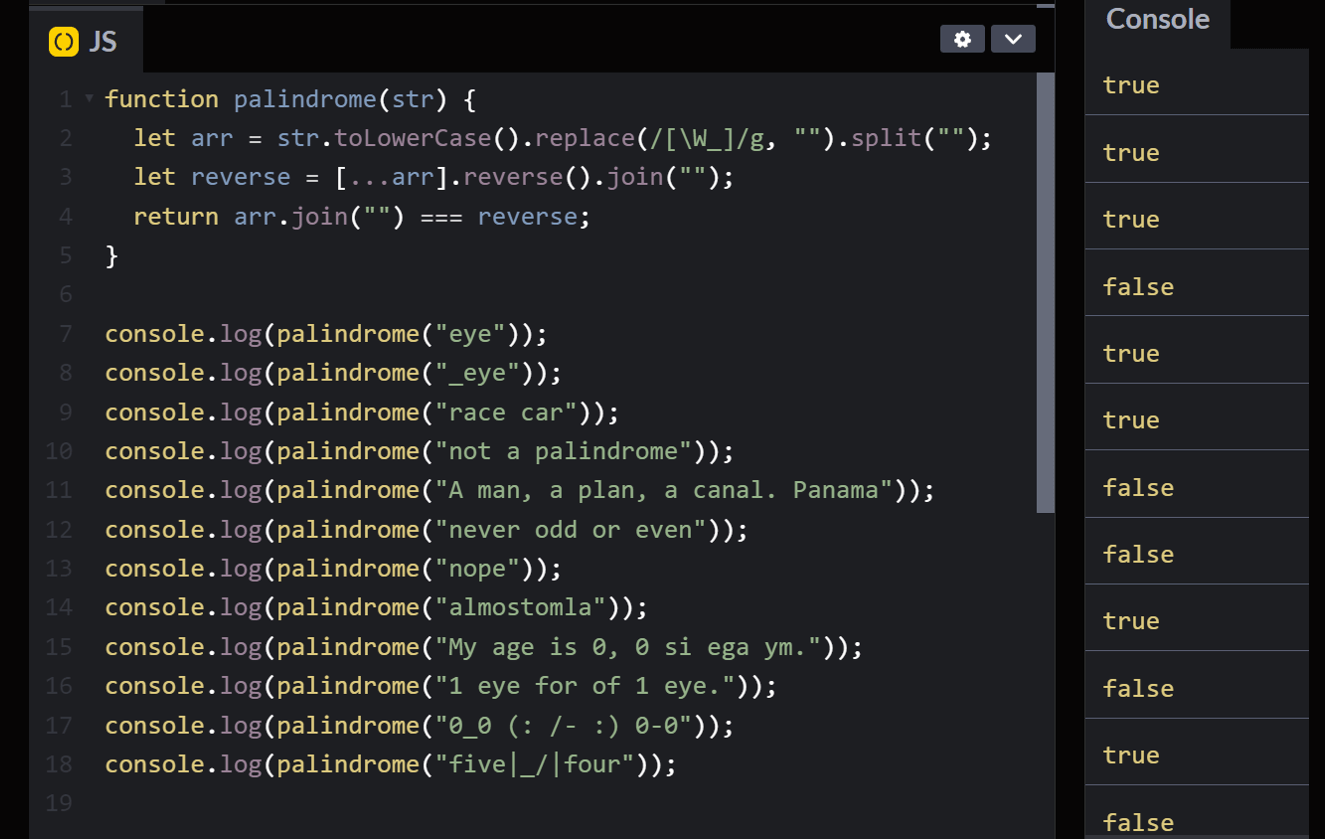
Palindrome Checker
I created a simple function in JavaScript to check if a word or sentence is a palindrome, meaning they are spelled the same way forward and backward, ignoring punctuation, case, and spacing. My approach is to convert the input string argument to lowercase and remove all non-word characters with regex. I then check whether that string is equivalent to a backwards version that was split into an array, reversed, and joined back into a string.
Try on CodePen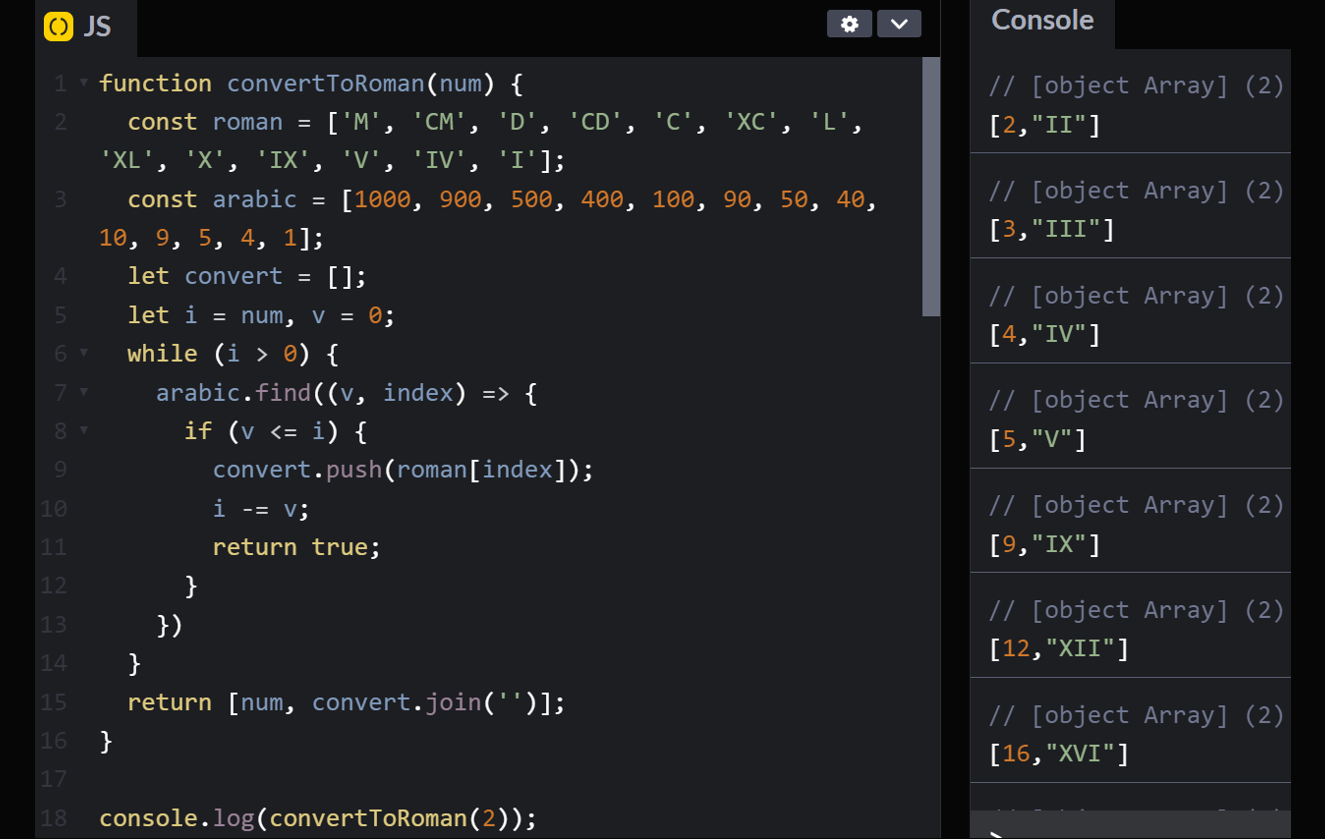
Roman Numeral Converter
This JavaScript project is a function that converts Arabic numerals to Roman numerals. In my solution, I begin with an array of 13 descending values in Roman numerals, covering each unique numeral and their “minus one” condition) and a corresponding array of those values as integers. I use a while loop to find the index of the largest value in the integer array that can fit into the number to convert, then subtract that from said number and push the Roman numeral at the corresponding index to a result array. The result array is then joined into a string and returned.
Try on CodePen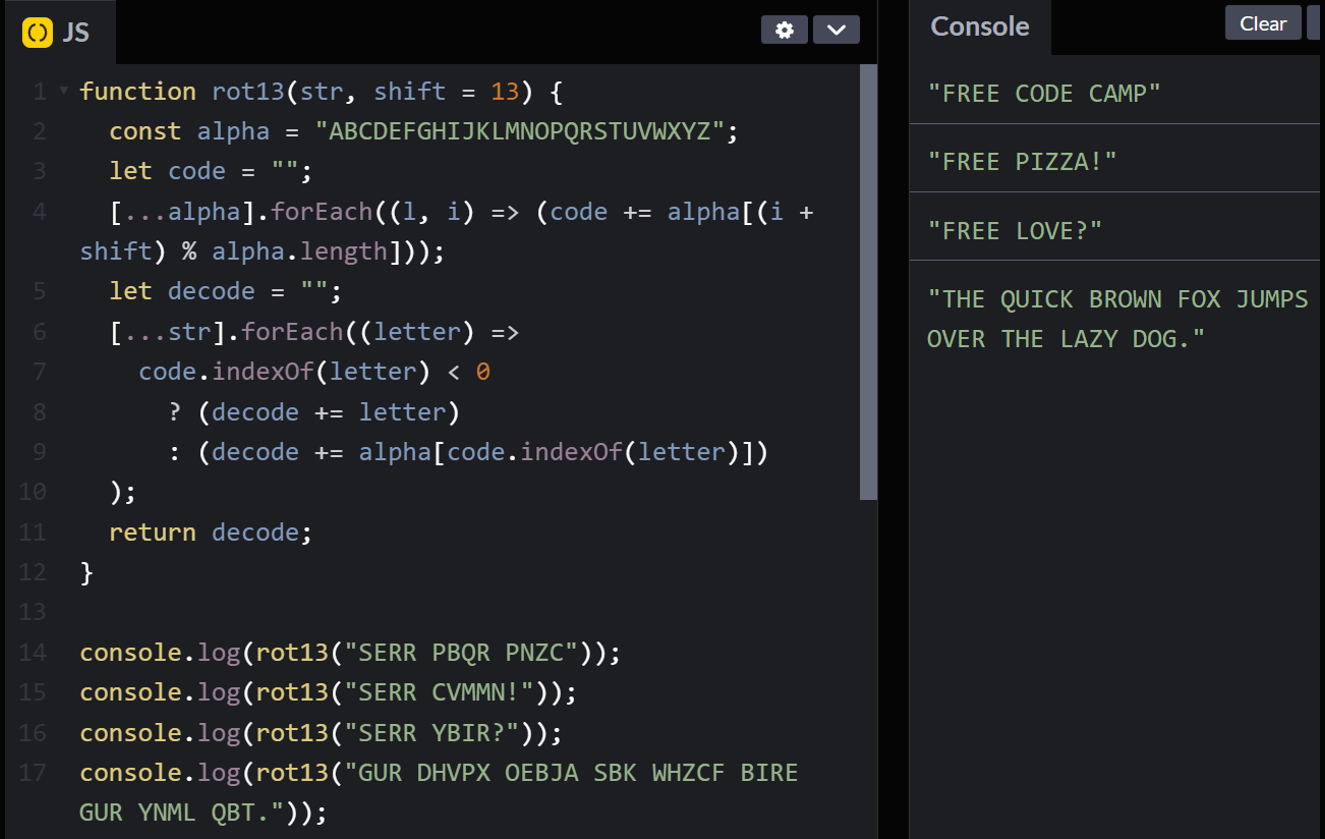
Caesar Cipher
I created this JavaScript function to decode a Caesar cipher, also known as a shift cipher, a type of substitution cipher in which each letter is replaced with the letter a set number of positions after it in the alphabet. My approach makes use of a “key” string with letters of the alphabet (A-Z) and a corresponding “value” string with the coded substitute values for each letter at the same index in the key. This general key-value-based approach can be used for any substitution cipher. To create the value string used here, for each index value in the key string I get the sum of that value and the shift value (i.e., 13), then use the remainder of the sum divided by the length of the key string as the index of the letter from the key to add to the value string. To decode the message, I iterate over the characters in the coded string argument. If a character is found in the value string, the index is returned and the letter in the key string at that index is added to the decoded message output. If a character is not found in the value string, then that character is added to the output.
Try on CodePen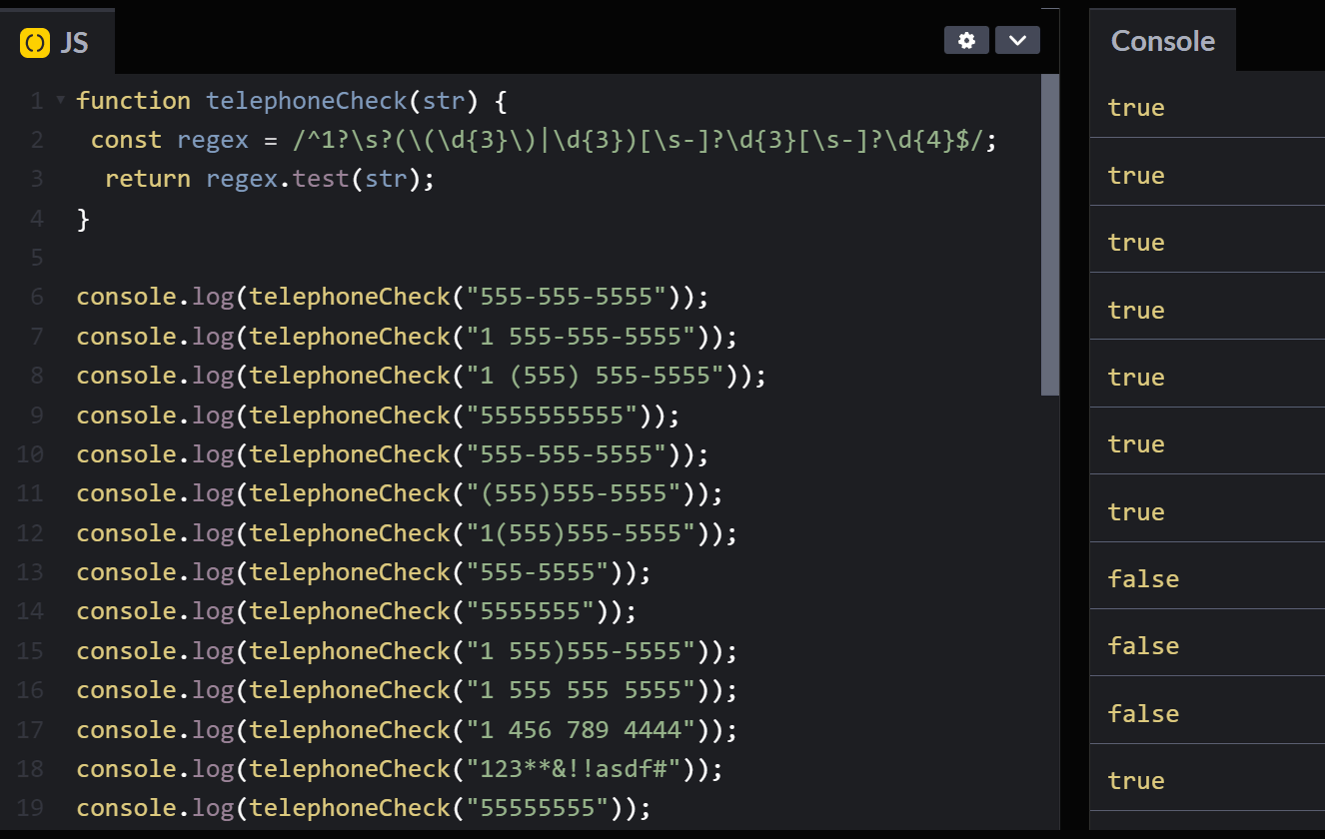
Telephone Number Validator
I built this JavaScript function to check if a passed string is a valid US phone number. In this particular project only a handful of specific phone number formats were to be considered valid, so I constructed a fairly simple regular expression using capture groups, quantifiers, and character classes to test all potential cases.
Try on CodePen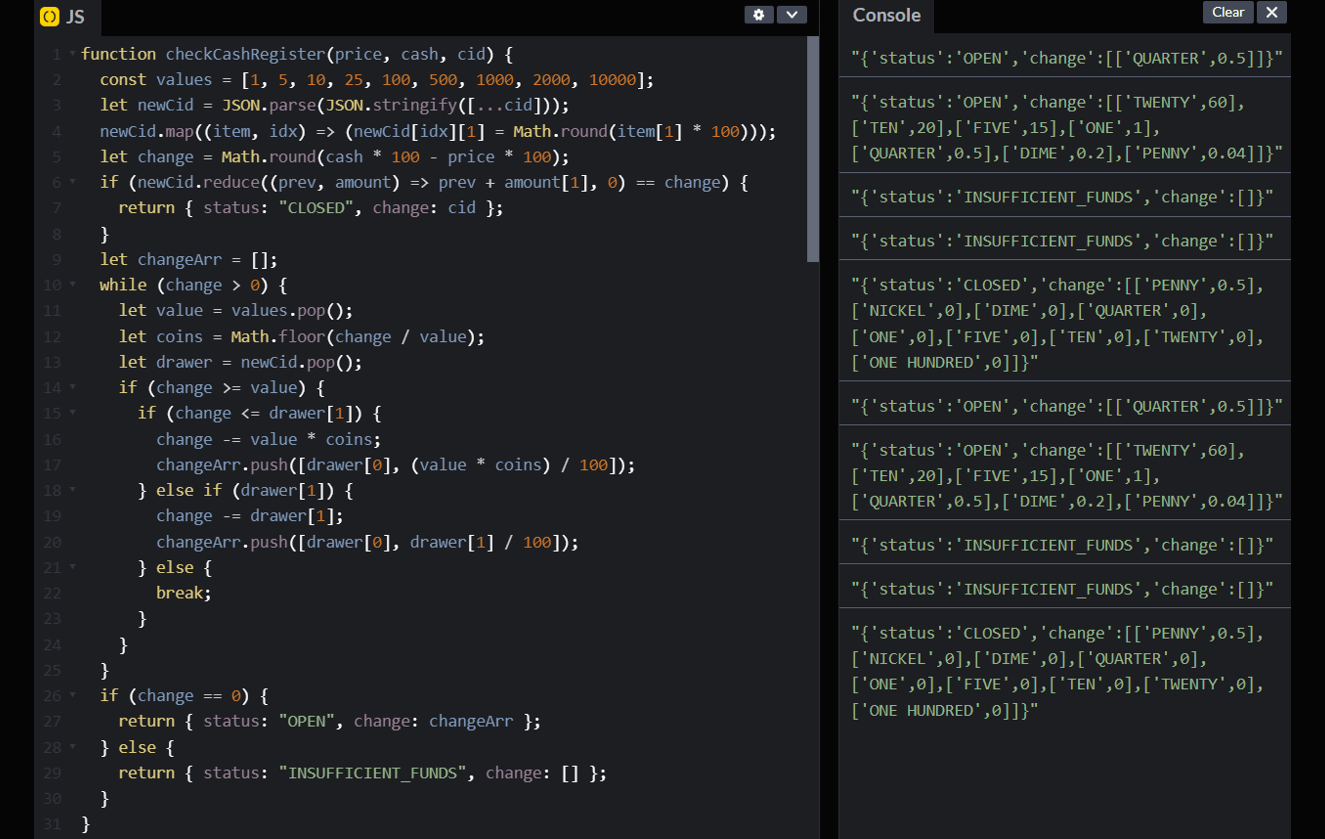
Cash Register
For this project I designed a cash register drawer function in JavaScript that accepts a purchase price, payment, and cash-in-drawer argument, and returns an object with keys for the drawer status and an array of change to be returned (if applicable). To avoid floating point precision issues, I multiply all numerical values passed in the arguments by 100 and round the products to the nearest integer; this operation is performed on a deep copy (using JSON.parse/stringify) of the nested cash-in-drawer array to avoid mutation. Next, my function calls a reduce function to get the sum of cash-in-drawer, and if this is equal to the value of change to be returned, returns the “CLOSED” status and the original cash-in-drawer argument. For other conditions, my function uses while loop to iterate over the denominations available in the drawer from largest to smallest, and if the denomination is less than or equal to the remaining change to be returned, it subtracts the maximum available value of that denomination from the remaining change and pushes that value (divided by 100) and denomination to an array of change to return. Once the remaining change is zero or all denominations have been checked, my function returns the “OPEN” status and the array of change if the remaining change is zero, otherwise it returns the “INSUFFICIENT_FUNDS” status and an empty array.
Try on CodePen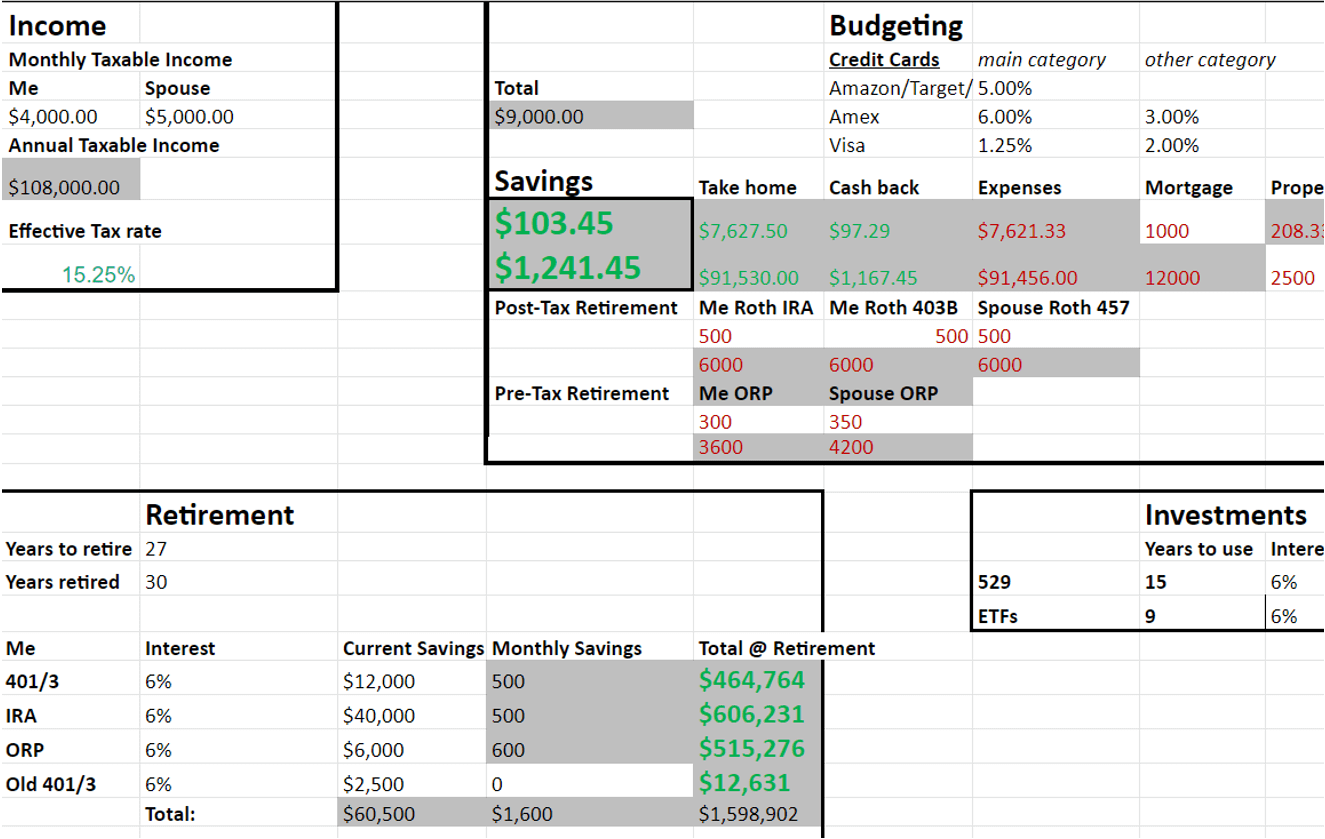
Budget, Investment & Retirement Estimator
I created this spreadsheet to estimate monthly and annual budgeting, personal investment returns, and retirement savings and income. I account for multiple flexible spending categories, effective tax rate, pre- and post-tax investments, credit card rewards, expected social security income, and inflation. Calculated values are highlighted with conditional formatting. I implement the PMT and FV Excel/Google Sheets functions to calculate disbursements and investments/inflation, respectively.
Try on Sheets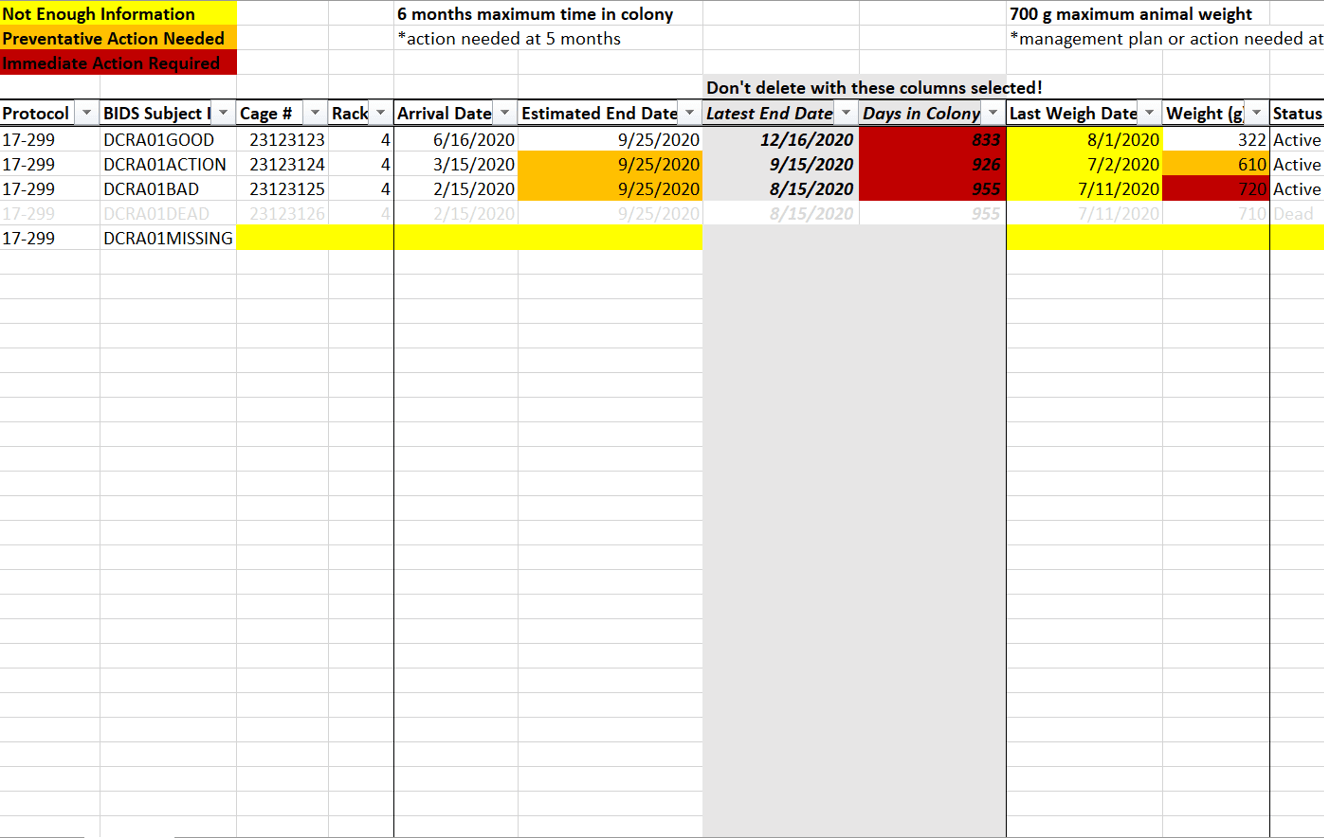
Research Subject Management Log
I built this Excel spreadsheet in order to streamline monitoring and management of research animal colonies. I use conditional formatting to alert investigators to potential issues with their animals, and employ conditional calculations to provide key compliance milestones, where applicable. Users can toggle entries between active and inactive, respectively hiding or showing their status, and easily customize their view with preset sort and filter buttons. Custom data validation settings and alerts are enabled on all columns to ensure accurate data entry and discourage unintentional changes to formatting and equations.
Download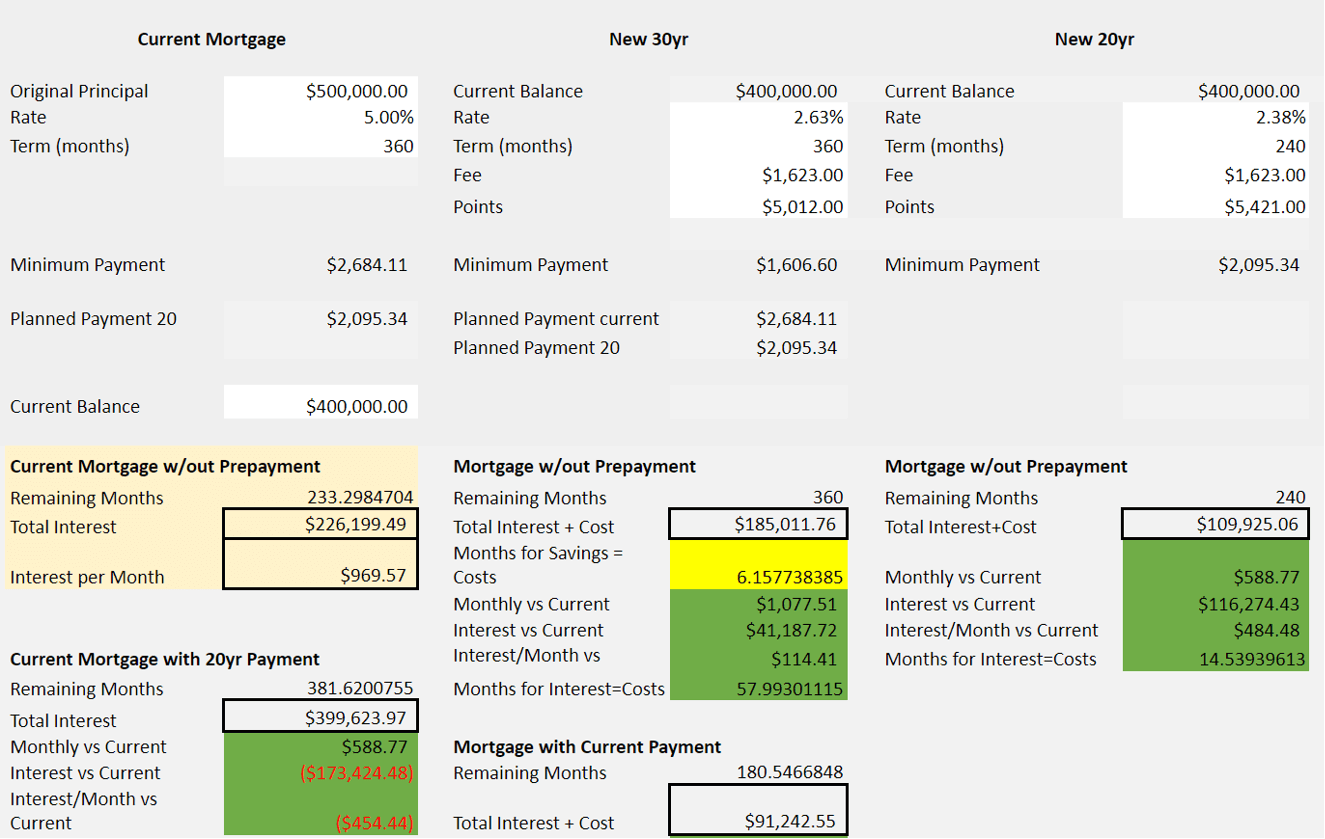
Mortgage Refinance Calculator
It can be challenging to make an informed choice between home mortgage refinancing products. I developed this spreadsheet to calculate directly comparable risk and reward metrics for multiple loan products and repayment scenarios. This spreadsheet takes as input the original and current principal, and the interest rate, term, fees, and points of different loan products (e.g. the original loan, and a 30-, 20-, and 15-year refinance loan), and calculates the difference in lifetime interest, interest each month, and monthly payments between all products, and the time period to recoup fees accounting for either savings in interest or monthly payments. I implement the PMT, NPER, and CUMIPMT Excel/Google Sheets functions to calculate planned payments, remaining payment periods, and lifetime interest, respectively.
Try on Sheets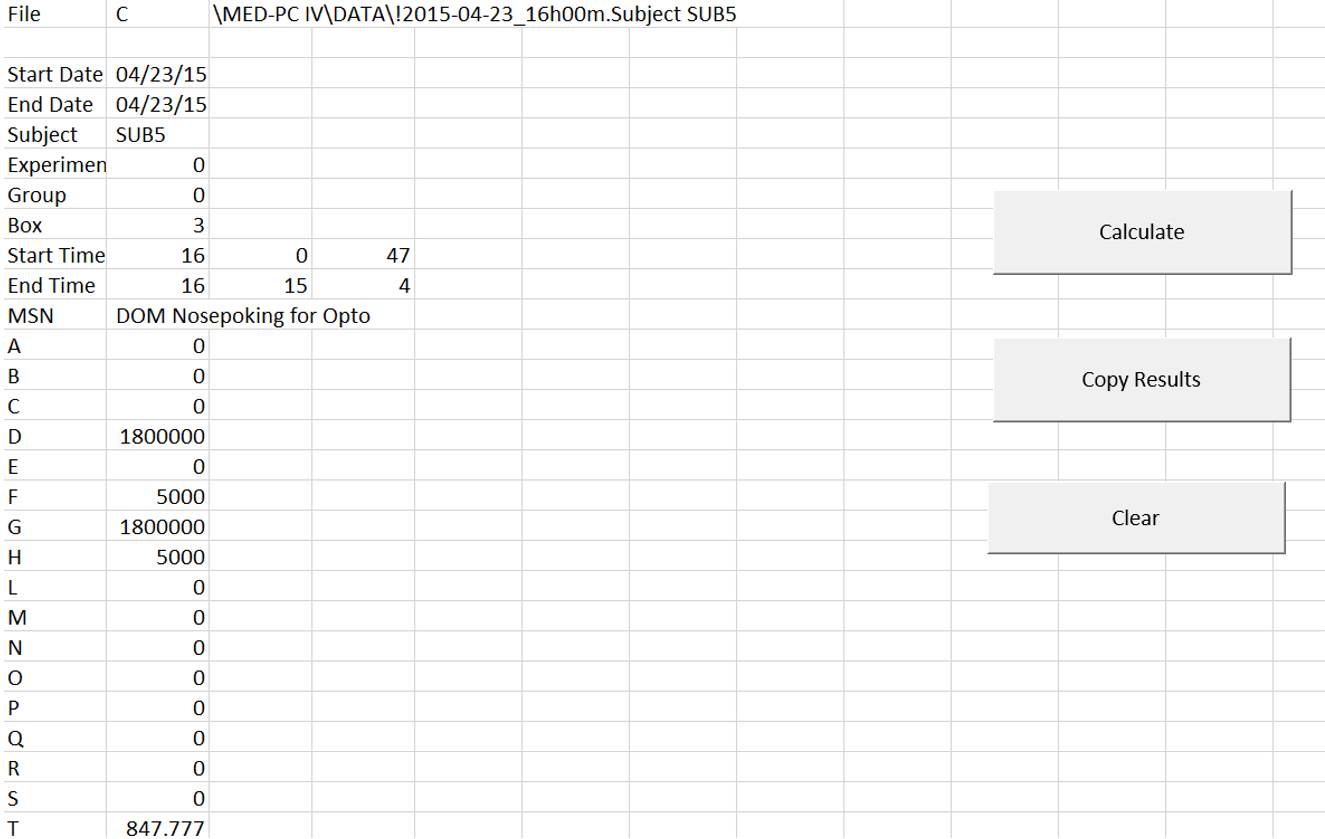
MED Associates Data Converter
I created this Excel-based tool for researchers that may be unfamiliar with data handling scripts to easily convert single-column text output from proprietary MED Associates behavior testing/DAQ systems into a standard tabular format organized by variable names. I use a brute force approach that applies a series of conditional logic functions to each cell. First, I copy the original data while checking for patterned breaks (cells without values), indicating the start of a new variable, and divide variables into new columns by shifting the copied data one column to the right at every detected break. Second, I use the Excel indirect, address, row, and column functions to create new addresses that begin at row 0 for the contents of each new data column. Finally, I use these new addresses to create a formatted copy of the data into the results sheet. To improve the user experience and help preserve the integrity of the equations, the intermediate functions are stored on hidden sheets and VBA macro buttons are provided that call the clear, copy, and calculate function on the input sheet, result sheet, and workbook, respectively.
Download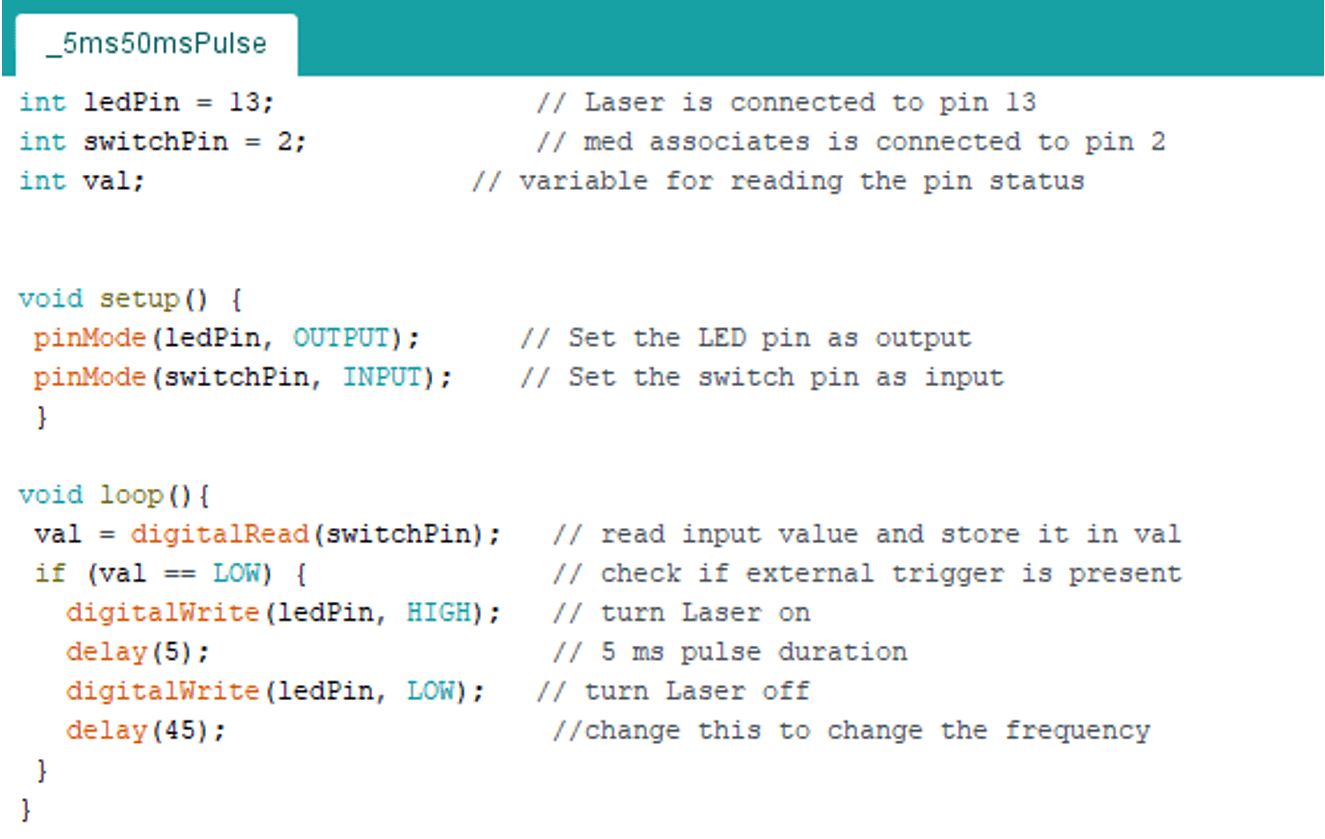
Arduino Input and Output
Precise, automatic, and often high-frequency timing and synchronization of experimental devices can be crucial for delivering experimental manipulations and/or collecting high-quality real-world scientific data. To this end, I have designed, tested, and implemented solutions using Arduino microcontrollers to integrate and transform real-time input and output signals from experimental hardware devices. I share a straightforward protocol for using an Arduino device to deliver high-frequency optogenetic stimulation and many of the C\C++ based Arduino programs (termed “sketches”) that I have created on my GitHub.
GitHub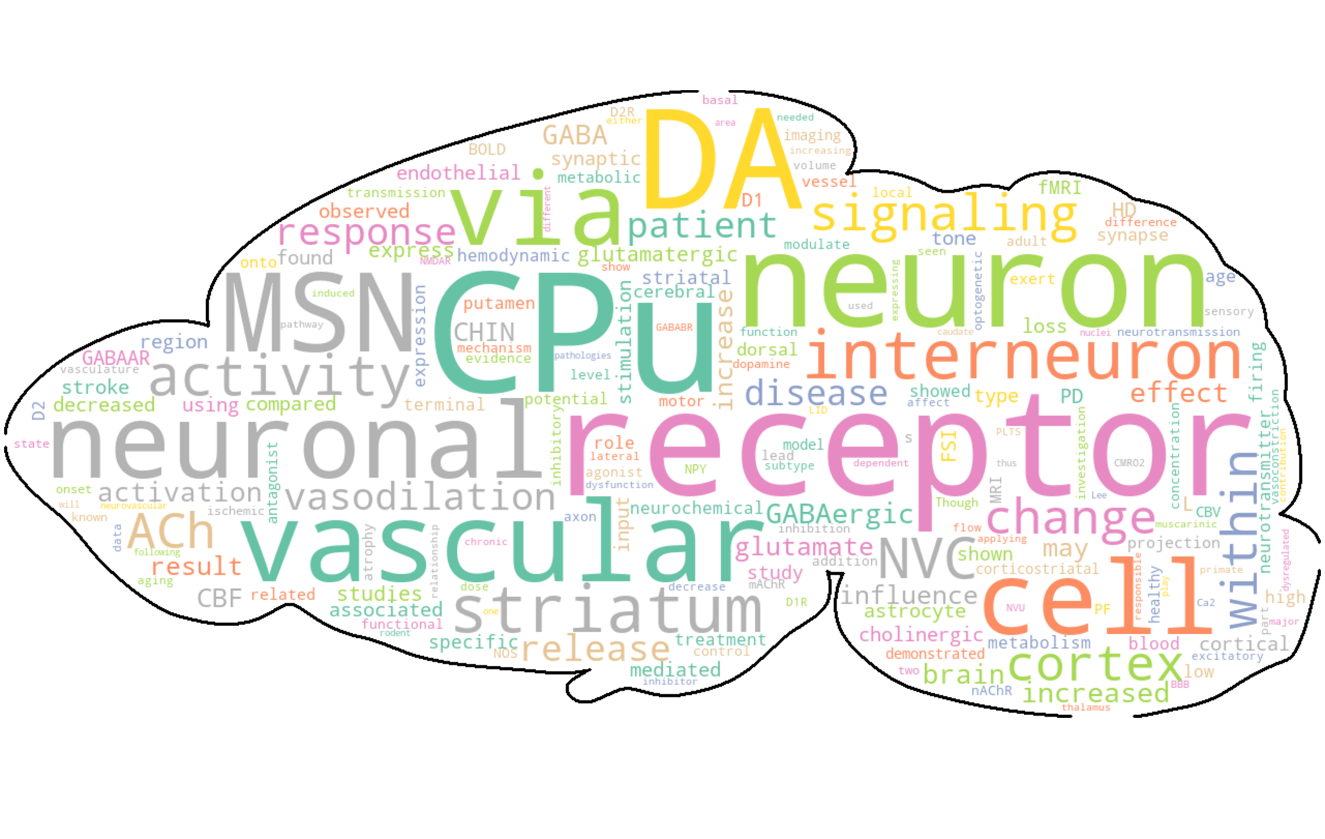
Word Cloud Script
Word clouds present a visually appealing alternative to histograms for the display of relative word frequencies in datasets and are commonly used to summarize the results of polls, sentiment analyses, or untargeted text dumps. For this project, I wrote Python scripts that import and parse WhatsApp plain text transcripts or paragraph/essay format MS Word documents, then feed these data into the Python wordcloud library. For added flair, an image can be passed to the wordcloud generator to define the word cloud shape and/or color scheme.
GitHub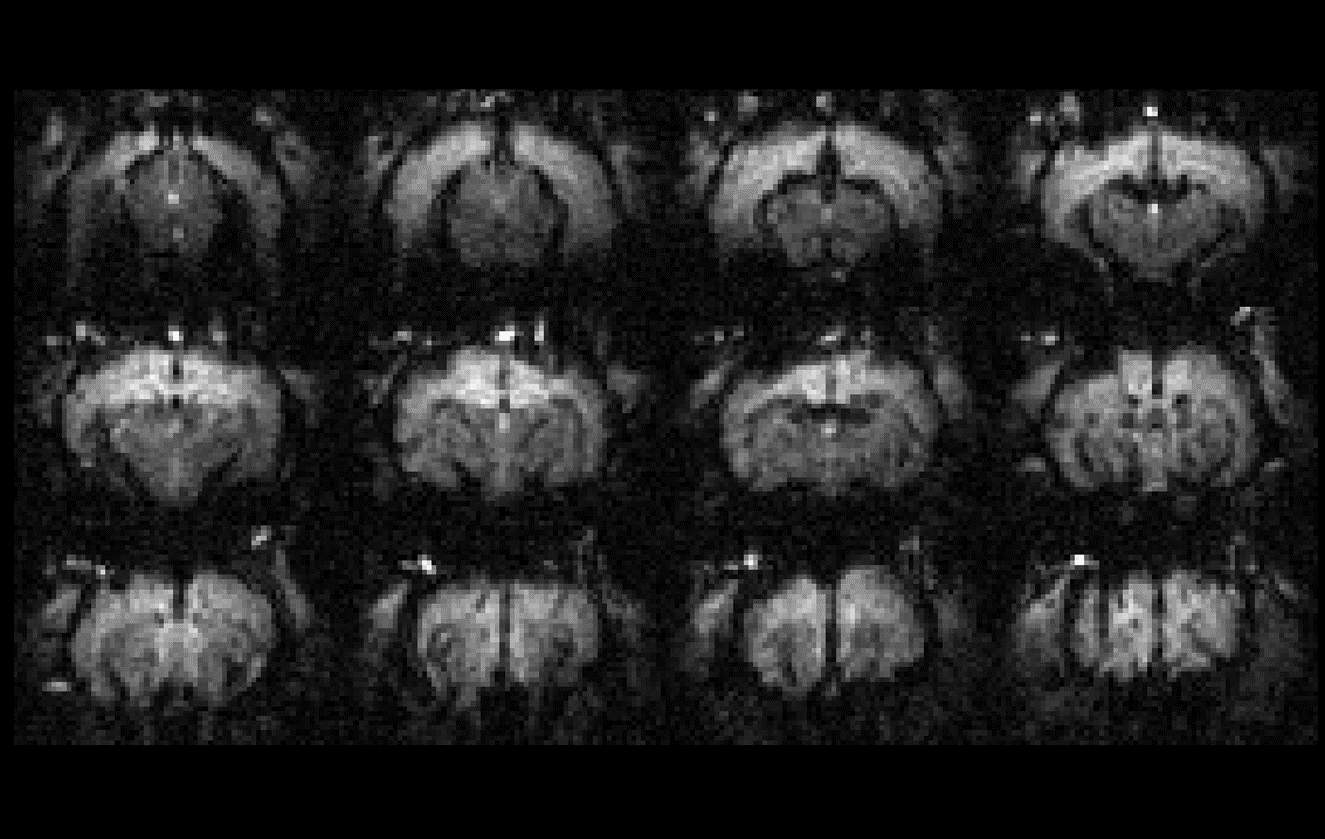
Quick MRI Visualizer
It is often desirable to quickly visualize entire image volumes from medical and neuroimaging file formats at the early stages of data analysis. While this function is available in several GUI based packages, this approach can be slow and results may not be easily reproduced. Here, I created a short Python script, which makes use of the NiBabel library, to quickly create montage images of entire image volumes using preset parameters and transformations. By accessing the image data as NumPy arrays while handling critical metadata (e.g., image orientation, scaling factors, timing), this script has options to seamlessly reorient, rotate, and rescale images. Additional functions are included to iterate over all files in a folder and automatically export image montages as graphics file formats.
GitHubContact
Let's work together! I'd love to hear from you about new data science projects, collaborations, and job opportunities.